Politics and Investing

Political news is dominating the front pages right now, with a presidential election in the US, general election in Australia and a referendum in the UK. What does it all mean for markets?

“It promises to be a nervous week for global markets as traders mull over the relative performances of the US presidential candidates. With no clear favourite, the US stock market is unlikely to find any clear direction until the winner is named.”

Does that sound familiar? That line from an article by the Reuters news agency was carried in newspapers around the world. Last week? Last month? No. In fact, that article is from September, 1988 and was about the Bush-Dukakis debates of that year.1

As in the 2016 campaign, that election pitted two non-incumbents against each other as President Reagan completed his requisite two terms. As 1988 began, the New York Times/CBS News Poll talked of a political mood of “drift and uncertainty”.2

This isn’t to imply that every campaign is the same, but it does serve as a reminder that markets regularly navigate political uncertainty. As for supposed “patterns” in election years, research shows 12-month results are strikingly similar to overall averages.3

Of course, the US is not the only country holding national elections or referendums this year. So is Australia, where, again, two party leaders with no experience of leading a campaign are vying for a lower house majority in a race which pollsters say is too close to call.

Prime Minister Malcolm Turnbull, leading the Liberal-National Coalition, and Bill Shorten, leading the opposition Labor Party, are standing on diametrically opposed platforms—the former promising corporate tax cuts and the latter more spending on health and education.

In the Philippines, a new president and self-declared “strongman”, Rodrigo Duterte, has come to power advocating extra-judicial killings to stamp out crime and drugs.

And in the United Kingdom, voters are due on June 23 to cast a ballot in a referendum on whether Britain stays in the 28-member European Union. The UK conservative government has warned voters of a possible recession should they opt for a “Brexit”.

What do all these events mean for equity markets, for government bonds, for commodities and for currencies? Those kinds of questions get a real workout at these times in the financial media, which inevitably finds a wide divergence of opinion from market observers.

While many people will have a keen interest in political outcomes, academic studies show little pattern in actual market returns during US presidential election years. Figure 1 shows the performance of the S&P 500 in 22 US election years dating back to 1928.


 SP_Perf_in_US_Election_Years

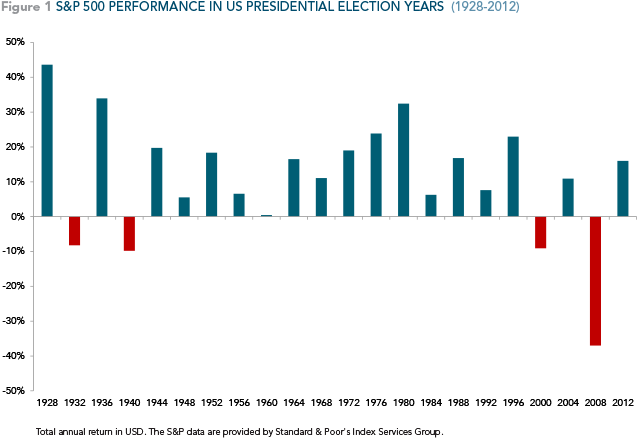
You can see in four of those years, the market fell. In the other 18 instances, it rose. But the truth is this sample size is too small to make any definitive conclusions. And, in any case, it is extremely hard to extract the political from other influences on markets.

For example, the worst annual market outcome during a US presidential year in this sample was 2008 when Democrat contender Barrack Obama defeated Republican nominee John McCain. But if you recall that was also the year of the collapse of Lehman Brothers and the global financial crisis.

Another down year for the market was 2000, the year Republican George W Bush defeated Democrat Al Gore in a tight contest. But that was also the year of the collapse of the bull market in technology stocks, the so-called “tech wreck”.

The point is that any one time markets are being influenced by a myriad of signals and events—economic indicators, earnings news, technological change, trends in consumption and investment, regulatory and policy developments and geopolitical news, to name a few.

So even if you knew ahead of time the outcome of an election in one country, how would you know that events elsewhere would not take greater prominence for the markets?

Keep in mind, also, that elections have a limited range of possible outcomes—a clear win for candidate or party ‘A’ or ‘B’, or an inconclusive result. Markets will adjust ahead of time to deal with risks around these outcomes. And the degree to which they move on the result will often depend on how much it varies from the consensus expectation.

So while we have responsibilities as citizens to take an interest in elections, it is by no means clear that these events have long-term implications for our decisions as investors.

That is much more a matter of our own goals and risk appetites, our investment horizons, the structure of our portfolios, our degree of diversification and the costs we pay.

Living on the Edge

Digital innovation has democratised access to financial information to the point where anyone with a smartphone, a few apps and real-time news and data feeds can be like a pro trader. But who wants to do that? And do you need to?

In the world of information flows, speed is barely an issue anymore. And the old hierarchies, where professionals with state of the art systems had priority access to breaking news, have been progressively dismantled.

For instance, a $500 smartphone with a 1.3 gigahertz processor is more than a thousand times faster than the Apollo guidance computer that sent astronauts to the moon nearly half a century ago. Its internal memory is 250,000 times bigger.

The upshot is that financial and other information comes at us faster and in greater volumes than ever. We no longer have to wait for the six o’clock TV news to know what happened in markets today. Our apps notify us in real time.

But amid this era of always-on news flow, the big question for most of us is not about our access to real-time information; it’s about whether we actually need to be so plugged in to have a successful investment experience.

Dealing with that question starts with reflecting how much of an investment “edge” you get by having access to information that is so freely available.

On that score, there’s an old concept in economics called the law of diminishing returns. It essentially says that adding more and more of one input, while keeping everything else constant, gives you progressively less bang for your buck.

At the industrial end of this technology arms race, you have the high frequency traders who spend a fortune on advanced communications infrastructure to try to take advantage of split second changes in millions of prices. On the evolutionary scale, these computer programs make smart phones look like ploughshares.

So against that background it’s not clear that adding the latest market-minder app to your iPhone is necessarily the path to investment success.

The second question to ask is what you are trying to achieve. Are you trying to “beat” the market by finding mistakes in prices and timing your entry and exit points? If so, and given the competition above, you might want to review your information budget.

The truth for most of us is that investment is not an end in itself, but a means to an end. We want to save for a house or put our children through school or look after aging parents or give ourselves a good chance of a comfortable retirement.

In this context, the most relevant information is about our own lives and circumstances. How much do we spend? How much can we save? What’s our risk appetite? What are our future needs? And how much of a cash buffer do we need?

This is the value an independent financial advisor can bring—not in trying to second-guess the market or using forecasts to gamble with your money—but in understanding the life situation of each person and what each of them needs.

Ultimately, markets are so competitive that we really are wasting our own precious resources by trying to game them. What most of us need is to secure the long-term capital market rates of return as efficiently as possible.

So our limited resource is not speed or access to information, but our own time. We only have a short window to live the lives we want. And that means we should start any investment plan with understanding ourselves.

That’s where the edge is.

The Policy Maze

Along with market ups and downs and media noise, government policy is one of those things that investors can’t control. But a good financial advisor can still help them navigate successfully through a constantly changing environment.

The risks that policy change poses to investors were dramatically highlighted by the recent federal budget in Australia, where a cash-strapped government announced the biggest shake-up in superannuation in at least a decade.

The announcement came just hours after another surprise policy change as the Reserve Bank of Australia cut its official cash rate to a record low of 1.75%, citing unexpectedly lower inflation and further signs of an economic slowdown in China.1

In the budget, the government argued it is seeking to better target tax concessions for superannuation and to bring the system in line with its objective of “providing income in retirement to substitute or supplement the age pension”.2

The changes include:

  • A $1.6 million cap on how much individuals can transfer into retirement accounts
  • The reduction in the income threshold to $250,000 (from $300,000) for paying a 30% (instead of 15%) tax on concessional super contributions.
  • The lowering of the cap on tax concessional contributions to $25,000
  • A $500,000 lifetime cap on non-concessional contributions
  • A superannuation tax offset for people on incomes below $37,000

Many of these measures had been well flagged, but the $1.6 million retirement account cap was a genuine surprise to most observers, as was the RBA’s rate cut. Indeed, news agency Bloomberg reported on the morning of the central bank meeting that 15 out of 27 economists expected no change in rates.3

While the government says the changes in the tax concessions will not affect 96% of superannuation fund members, there clearly will be implications for many more people in the future as they progress to higher incomes.

Others can argue the rights and wrongs of these particular changes, but there is no question that the complexity and flux in superannuation rules highlight the value that an expert, independent financial advisor can bring to individuals and families.

For instance, how can you maximise your retirement income and minimise your tax? What do the changes mean in terms of when you can afford to retire? What tax-effective investment solutions are available to you outside super? If you come into an inheritance or sell a business, what are your options now?

In the case of the rate cut, people may ask about the effect of interest rate changes or inflation on their retirement saving and what strategies are available to ensure they can maintain their consumption as planned.

There are many possible challenges and questions that advisors can deal with at times like these, not only because of the complexity of tax and regulation but also due to the complexity and variability of people’s lives, circumstances, risk appetites and preferences.

And all of this takes a human advisor, as no robot or sophisticated algorithm can be programmed quickly enough to deal with policy changes that come out of left field.

Yes, change can be unsettling and makes many of us anxious. But the unpredictability of government policy, like the unpredictability of markets, will always be with us.

Like a sailing boat skipper who knows how to set the sails to deal with shifting winds and choppy seas, your financial advisor can provide the right combination of structure and flexibility in your portfolio to help you cope with policy change.

Second Hand News

Why don’t the media run more good news? One view is bad news sells. If people preferred good news, the media would supply it. But markets don’t see news as necessarily good or bad, rather in terms of what is already built into prices.

One academic study appears to confirm the view that the apparent preponderance of bad news is as much due to demand as to supply, with participants more likely to select negative content regardless of their stated preferences for upbeat news.1

“This preference for negative and/or strategic information may be subconscious,” the authors conclude. “That is, we may find ourselves selecting negative and/or strategic stories even as we state that we would like other types of information.”

So an innate and unrecognised demand among consumers for bad news tends to encourage attention-seeking commercial media to supply more of what the public appears to want, thus fuelling a self-generating cycle.

Insofar as consumers of news are investors, though, the danger can come when the emotions generated by bad news prompt them to make changes to their portfolios, unaware that the news is likely already built into market prices.

This is especially the case when the notions of “good or bad” are turned upside down on financial markets. For example, stocks and Treasuries rallied and the US dollar weakened in early October after a weaker-than-expected US jobs report. Some observers said the “bad news” on jobs was “good news” for interest rates.2

Conversely, a month later, stocks ended mixed, bonds weakened and the US dollar rallied after astronger-than-expected payrolls number. While an improving job market is good news, it was also seen by some as cementing the case for the Federal Reserve to begin raising interest rates.

In both cases, the important thing for markets was not whether the report was good or bad but how it compared to the expectations already reflected in prices. As news is always breaking somewhere, expectations are always changing.

For the individual investor seeking to make portfolio decisions based on news, this presents a real challenge. First, to profit from news you need to be ahead of the market. Second, you have to anticipate how market will react. This does not sound like a particularly reliable investment strategy.

Luckily, there is another less scattergun approach. It involves working with the market and accepting that news is quickly built into prices. Those prices, which are forever changing, reflect the collective views of all market participants and reveal information about expected returns.

So instead of trying to second-guess the market by predicting news, investors can use the information already reflected in prices to build diverse portfolios based on the dimensions that drive higher expected returns.

As citizens and media consumers we are all entitled to our individual opinions on whether news is good or bad. As investors, though, we can trust market prices to assimilate news instantaneously and work from there.

In a sense, the work and the worrying are already done for us. This leaves us to work alongside an advisor to build diverse portfolios designed around our own circumstances, risk appetites and long-term goals.

There’s no need to respond to second-hand news.

The Volatility Trap

The degree of sharemarket volatility during the first three months of the year will regrettably have thrown some investors off their long-term course.

Let’s briefly recap by looking at the broad S&P/ASX 300. The index opened at 5249.10 on the first trading day of the calendar year but within three days had fallen below the much-watched 5000-point level.

The see-sawing index managed to finish the quarter above the 5000 mark at 5043.63 after a spurt on the last day of March. It was down 3.91 per cent for the quarter.

Investors who allow such abrupt short-term movements on the markets dictate their investment decisions are falling into what could be called the volatility trap.

Investors who fall into this trap often surrender their carefully-diversified long-term portfolios in an attempt to time the market. That is, trying to pick the best time to buy and sell stock.

However, most market-timers tend to sell stocks when prices have fallen – often seeking the perceived shelter of all-cash portfolios during periods of intense volatility – only to buy back into the market when prices have already recovered. In other words, such investors lock-in their paper losses.

When markets are particularly volatile, many investors also tend to focus solely on the changing prices of their shares, overlooking the critical contribution that dividends make to their total returns.

And yet another element of the volatility trap is that investors can lose their confidence about investing more of their savings into the market. This is despite the need for most of us to save for retirement and to meet our other goals.

One way that countless investors sidestep the perils of market-timing to keep on making new investments throughout changing market conditions is to practice the straightforward strategy of dollar-cost averaging.

Dollar-cost averaging simply involves investing the same amount of money into the sharemarket over regular time intervals – regardless of whether share prices are up or down.

Investors practising dollar-cost averaging buy more shares (or units in managed funds) when prices are lower and fewer when prices are higher. In short, purchasing costs are averaged over the total period that an investor keeps on investing – thus the name dollar-cost averaging.

Nevertheless, the core benefit of dollar cost averaging is not so much the price paid for shares; it is the adherence to a disciplined, non-emotive approach to investing that is not swayed by prevailing market sentiment.

The strategy can assist investors to focus on their long-term goals with an appropriately diversified portfolio while avoiding emotionally-driven decisions to buy or sell.

It should be emphasised that dollar-cost averaging does not guarantee that investments will succeed; nor does it protect investors from falling share prices. It does help foster sound investment practices.

Good investors know how to handle volatility. It is a fundamental skill. And that skill may be increasingly needed given that the 2016 Economic and Investment Outlook points to a “more challenging and volatile” investment environment over the long term.

Mattress Money

Official interest rates in Japan and Europe are now negative. Since these rates act as a benchmark for bonds, yields on many fixed income securities are also now below zero. What are investors to make of this?

The idea of negative interest rates can be tough to grasp. Essentially, it means that you pay a bank to look after your funds, instead of the usual practice where the bank pays you regular interest for having temporary custody of your money.

Central banks, whose job it is to implement a government’s monetary policy and issue currency, attempt to influence market interest rates by setting the rate commercial banks earn for depositing cash with them overnight.

The European Central Bank, along with peers in Japan, Switzerland, Sweden and Denmark, have all at times adopted negative interest rates recently in the face of very low inflation and the prospect of outright deflation, or falling prices.1

During a period of falling prices, real interest rates can be rising even if nominal interest rates are being cut. In such an environment, businesses and consumers may put off investing and spending on the view that it will be cheaper tomorrow.

This broadly is why central banks in those countries are cutting rates to zero or below zero. They are trying to lift inflation expectations, disincentivise saving, and, in turn, boost economic activity.

Figure 1 below shows overnight interest rates in some developed economies as of early March, 2016. These are the deposit rates that central banks set for commercial banks to leave funds with them overnight. The commercial banks in turn base their own lending rates to customers on the central bank benchmarks.

That’s all very well, you might say. But why would anyone want to pay a bank to look after their money? Why not just put the money under the mattress?

Well, first, it’s not very practical, or indeed safe, to store large amounts of cash at home. Second, some people are so focused on return of their capital over return on their capital that they are willing to pay banks to look after their money.

NEGATIVE BOND YIELDS

As well as overnight rates set by central banks and affecting retail deposits, yields on government bonds in a few countries have recently been below zero, in some cases out to maturities of 10 years or more, as in Switzerland and Japan.

Negative yields reflect both supply and demand factors, as well as the low inflation environment. On the supply side, central banks in Europe and Japan are still carrying out a policy called ‘quantitative easing’. This means that along with keeping overnight lending rates below zero, they are buying government bonds in a bid to flood the system with money and generate a self-sustaining economic recovery.

On the demand side, these negative bond yields might reflect a high degree of risk aversion among some investors. The emphasis in these cases is again more on capital preservation than on growth.

In terms of the economic environment, expectations that inflation will remain very low ameliorates one of the key risks for bond investors in that rising prices erode the purchasing power of the bond’s future cash flows.

DO BONDS STILL MAKE SENSE?

For global fixed income investors, negative interest rates and bond yields below zero may spark concern. But does it still make sense to invest in bonds at this time and what does it mean for returns from diversified portfolios?

There are a number of responses to those questions. First, interest rates and yield curves (the trajectory drawn by bonds of the same credit quality but different maturities) are not the same in every country. For example, policy rates in the USA, the UK, Canada, Australia, New Zealand and Norway are still positive.

Rates vary because economic conditions, demand and supply factors vary across countries. The US, for instance, began raising rates from near zero late last year amid evidence of strengthening activity. Australian cash rates are around 2%, among the highest in the world.

So these different interest rate structures in different markets provide us with a diversification opportunity. Figure 2 is a snapshot of the shape, as at 31 December 2015, of five different yield curves–Australia, the US, the UK, the Euro and Japan.

Second these overseas bond returns may not be negative once they are hedged back to local currencies using local interest rates. With Australian cash rates at 2% and New Zealand’s at 2.5%, that becomes the floor for investment in global bond markets.

Hedging provides the diversification benefits of different yield curves without the currency risks. Figure 3 shows how this works.

Third, what matters to investors is not so much the absolute level of yields, but how theychange. Yields and price are inversely related, so when yields fall, prices rise. That means that even if yields are negative, they could still fall further and provide a positive capital return.

Fourth, the shape of a yield curve is more important than the absolute level of yields. For an example, an individual curve can still be upwardly sloping even if it is below zero. (In this case, shorter-term yields are below longer-term). That gives you the option of taking more term risk and getting the benefit when yields fall (prices rise).

Finally, regardless of the interest rate cycle, bonds still play a diversification role in a portfolio composed of multiple asset classes in equities, property, cash and bonds. This is because they behave differently to those other assets.

SUMMARY

In summary, while interest rates and bond yields have turned negative in some economies as central banks attempt to stimulate activity, this doesn’t obviate the important role fixed interest can play in a diversified portfolio.

The benefits of taking a global approach to fixed interest, varying term exposure according to the range of opportunities available and hedging out currency risk remain as strong as ever.

As to the broader implications of negative interest rates for investment markets, we have not seen this phenomenon for a sufficient time to draw any firm conclusions.

In the meantime, don’t go rushing to put your money under the mattress.

APC Market Commentary (Mar 2016)

In recent times we have seen an increase in share market volatility driven largely by negative sentiment about the state of the global economy.  In September last year we communicated to you about the main causes for this.  In summary and in no particular order of importance they are;

  1. Ongoing concern about the state of the Chinese economy
  2. The US Federal Reserve decision to increase official interest rates
  3. The Syrian conflict and the associated humanitarian crisis now playing out in that region and Europe more broadly

In addition to these challenges there has been significant downward pressure on commodity prices which has obvious negative connotations for Australia and makes dealing with the Federal budget that much harder as our terms of trade (national income) have fallen over this time period.

Having said that, our economy is making the transition from enjoying the fruits of the mining boom (which is now well and truly over) to a more diversified and balanced economy.  This transition is not easy, however it will deliver a far more resilient and dynamic Australian economy in the future.  This is a good outcome.  In the meantime we have stable employment growth and our economy is growing.  Recent economic data shows our economy growing at an annualised pace of 3% which all things considered, is an admirable effort.

What does this mean for markets?

As you know APC tilts our portfolios to particular sectors of the share market.  These are Smallcompanies and Value (or cheap) companies.  When sentiment is positive (or confident) these two sectors tend to outperform the broader market.  However when sentiment is negative, as it has been over the past 9 months, these sectors tend to underperform the broader market.  Over the near 30 years that APC has been operating, we have seen these times before.  Sentiment always returns to positive, from a period where it has been negative.  The only question we don’t know the answer to is when this will happen.  In the last six months small companies have outperformed both Value companies and Large companies in Australia and Globally.

What to do?

What we certainly do not do is panic!  We’ve seen these times before and we will see them again.  So, as per our communication in September last year, if you are a long term investor (not speculator) focusing on Wealth Accumulation, periods like this are fantastic buying opportunities.  If you are Consuming your wealth to support your lifestyle in retirement, APC has once again implemented our Defensive Pension Strategy, whereby we fund pensions from defensive assets (cash and bonds) only.  In doing so we protect growth assets (shares and property) by not selling them during heightened periods of share market volatility.

APC monitors these decisions regularly on your behalf.  Our Directors and Shareholders, as well as team members, are also invested in our Classic portfolios.  Rest assured that our recommendations to our clients are also the same recommendations for our own portfolios.

Are We There Yet?

The twists and turns of financial markets in the opening weeks of 2016 have left many investors feeling like victims of car sickness. So what’s driving the volatility, how unusual is it and what can you do about it?

Volatility is not unusual at times of heightened uncertainty. Some of the issues cited as unsettling markets recently have been doubts about the extent and impact of China’s slowdown, steep declines in oil prices and what all this might mean for the path of US interest rates this year.

But such external events are not the only things that influence prices. Markets can also move based on investors’ own changing tastes, preferences and risk appetites. None of these variables are constant.

The key point is that expectations about the global economy, company profits, interest rates and other indicators constantly change on new information. And those changes are reflected in the prices of securities.

Indeed, if prices didn’t change at all based on news, there really would be cause for worry because it would raise questions about whether markets were working effectively.

So are the recent market moves out of the ordinary and do they necessarily point to further price declines? Let’s look at the data…

The world’s biggest stock market did have a particularly poor start to the year. In fact, as measured by the benchmark S&P-500 index, the US market suffered its ninth worst January since records began in 1926.

Does this mean it is on course for a down year? Not necessarily. In the US market over the past 90 years, a negative January has been followed by a positive performance for the rest of the year 59% of the time.

What about the Australian market? It’s true that the S&P/ASX 300 total return index fell 3.2% in January, but that is nowhere near its worst start to the year. In the first month of 2008, for instance, it fell 11%. In 1981, it fell 7.7%.

While Australian data only goes back to 1980, there is also no clear pattern here between January and full-year performance. A negative start in 1993, for example, was followed by a full-year return that year of more than 40%.

In more recent years, who can forget the early months of 2009 during the peak of the global financial crisis? The Australian market started the year with a fall of nearly 5% yet by the end of that year was up by more than 37%!

The chart below shows that of the past 36 years back to 1980, the Australian market has risen in 26 years and fallen in 10. While the return in January has been negative 14 times, in nine of those the market ended up for the year.

This isn’t to predict that we’re on course for a similar turnaround in 2016, but it does serve as a reminder about the danger of drawing inferences about future market direction from what has happened in the immediate past.

How about the pattern of recent volatility? Every day, it seems, we hear on the morning radio news of a big fall on Wall Street, only to be told of a similarly spectacular rebound a day or two later.

The truth, however, is the recent bout of volatility has not been exceptional. In the US market, a common measure of equity volatility is the ‘VIX’ index. This jumped to around 27 in January from the mid-teens late last year. (A higher number means more volatility).

But that is still only about half of the levels of August to September last year when China devalued its currency, in mid-2013 at the time of the so-called Fed “taper tantrum” and again in in mid-2011 when global recession fears were intensifying. And it is virtually a quarter of the peak levels the VIX reached when Lehman Brothers collapsed in October 2008.

Similarly, in Australia, volatility has risen this year, but it is well short of the levels experienced in the GFC. Chart 2 below shows the S&P/ASX-300 index as measured by historical volatility on a 15-day rolling basis.

So what lessons can be drawn here? And more importantly, what can you as an individual investor do about the volatility?

  • First, there is no hiding from the fact that for many investors market volatility can be unsettling. But we have seen that extrapolating past market moves into the future is not a reliable strategy.
  • Second, prices move on news. Unless you have the extraordinary and unheard of ability to anticipate news, you can’t predict with any consistency what markets will do next.
  • Third, while you can never fully escape volatility, you can moderate the ups and downs by diversifying across different asset classes (stocks, bonds, property and cash) and within asset classes.
  • Fourth, what ultimately matters is not your ability to second-guess short-term market moves, but how your portfolio is travelling relative to your own stated goals, risk preferences and investment horizon.

If you feel uncertain, your advisor is there to keep you focused on your long-term plan and to rebalance your portfolio to ensure you are not taking any more risk than you need to reach your objectives.

To use our original analogy, constantly watching the short-term gyrations of the market when your goal may be years away is like reading in a car on a rocky and winding country road. You risk getting car sick.

A better approach is stay focused out the window on that particular point on the horizon that represents your destination. Every now and then, you can pull over to the side and check your roadmap (in this case your financial plan).

Everyone feels the rough ride, it’s true. But if you can agree with your advisor that your plan is still the right one for you and that you remain on track to reach your destination, the process of getting there becomes a lot easier.

There’s No One-Size-Fits-All Retirement Income

An adequate retirement income is – like beauty – all in the eyes of the beholder. The Australian superannuation system has for the past 20 years been concentrated more on the value of the account balance at the time of retirement – the ‘how much is enough’ question.

That debate is now shifting quite noticeably into the realm of what is the level of retirement income required.

Neither question comes with a definitive answer.

But we should expect the definition of “adequate” to become one of the most heavily debated concepts in superannuation in the year ahead.

The Federal Treasurer, Scott Morrision, has already kicked things off from the government’s perspective with his speech to the recent Association of Superannuation Funds of Australia (ASFA) conference in Brisbane.

He outlined the high-level framework of how the federal government is thinking about super – particularly the cost of tax concessions that super savings enjoy.

He said that “as a government we want to be very sure that superannuation tax concessions are appropriately targeted so that they can secure an adequate retirement income for Australians”.

So, what does Mr Morrison define as “adequate”?

He understands this is a long way from being an exact science but suggested one approach is to use income replacement rates – where retirement income is given as a percentage of pre-retirement earnings.

The Melbourne Mercer global Pension Index, for example, suggests a replacement rate of 70 per cent is a suitable level that someone on a median income should aim for.

Such measures are useful as a starting point but clearly a range of personal circumstances are major drivers of what is an adequate level of retirement income for you.

ASFA publishes indicative retirement income rates on its website for what it terms a “modest” retirement and a “comfortable” retirement level.

It estimates that an income of $34,200 will give a couple a “modest” retirement lifestyle, while those looking for a “comfortable” although by no means lavish lifestyle will need around $58,000 a year.

The debate over what is “adequate” is important because Mr Morrison has clearly signaled that the objective of the super system should not be for it to be used as an “open-ended savings vehicle for wealthy Australians to accumulate large balances in a tax-preferred environment”.

The government has committed to adopting a key recommendation of the Financial System Inquiry which will enshrine the objective of the super system into legislation. We should expect the delivery of retirement income to feature strongly in the super system’s objectives.

It will be a critical reference point as the various policy positions are debated through next year ahead of the next federal election.

For younger members of super funds the debate may well seem academic. For those people within a few years of retiring – along with those already retired – it will be of critical concern.

While the public policy debate will frame the broad issues of equity and sustainability for the system the challenge for individual fund members is to understand what their retirement adequacy level looks like.

That is where specialist advice that factors in your unique personal circumstances, potentially in combination with the age pension, can build out a retirement income plan will take an abstract, high-level policy debate and deliver it in a real-world way to your front door.

Then you can be the judge of whether “adequate” is a thing of beauty or an ugly set of numbers.

The Deep End


Have you ever seen a child standing tentatively at the edge of a swimming pool? She’s torn between her desire to join the gang in the water and her fear of diving in. In committing to the market, investors can be like that.

You can always find a reason for not investing. “Perhaps I should wait till after interest rates rise?” goes one line of the thinking. “Or maybe I should delay till there’s more clarity on China? Or hold back until after earnings season?”
Emotions and assumptions usually underlay this indecision. The emotion can be anxiety about “making a mistake” or fear of committing at “the wrong time” and suffering regret. The assumption is that there is a perfect time to invest.
Obviously, the ideal solution would be to enter the market just as it bottoms and exit the market right at the top.
But the reality is that precisely timing your exit and entry is close to impossible. If it were easy, millions would be doing it and getting very rich in the process. Instead, the only ones who tend to consistently make money out of market timing are those who write books about it.
The financial media certainly love market timing stories. For one thing, there is always some event or variable they can peg it to—like a decision on interest rates or upcoming earnings or a chart indicator. For another, the idea of timing the market is a powerful one and tends to get readers’ attention.
For example, one high-profile US forecaster in early 2012 predicted a 50-70% equity market decline over the following two-to-three years. It was to be a replay of the 2008-09 crisis, he said, but with an even deeper recession.1
That turned out to be a bad call. Global equity markets, as measured by the MSCI World Index, delivered a total positive return in Australian dollars of 93% from the end of 2011 to the end of 2014.2 In USD, it was 53%.
Others advocate more elaborate timing strategies. For instance, one recent academic paper suggested the stock market delivers better returns relative to Treasury bills in the second, fourth and sixth week after each of the US Federal Reserve’s policy-setting meetings in a given year.3
The idea here is that the Fed leaks information about its interest rate intentions in such a predictable way that, even without the information, savvy investors can make money by just buying stocks in certain periods.
While these theories can be fascinating, it is arguable how many of us have either the time or inclination to try them out. And even if we did, this does not take account of the costs of all the required trades or the possibility that as soon as we implemented the idea it would be arbitraged away.
So ahead of a central bank meeting, some would-be investors fret about whether they should hold off until they see how the market reacts. Others already invested worry whether they should take their money out.
The truth is that for long-term investors, these issues should be irrelevant. What matters is how their portfolios are structured and how they are tracking relative to their chosen goals. Markets will go up and down, security prices will change on news and it makes little sense to second guess them.
But while no one yet has come up with a consistently successful strategy for timing the market to perfection, there are some things that everyone can do to help ease the anxiety they feel about investing.
One is to realise that it does not have to be a choice between being 100% in the market and 100% outside. Ideally, an investor should stick to their strategic asset allocation—be it 70/30 or 60/40 or 50/50 equity/bonds.
Another is that this strategic allocation can be combined with periodic, disciplined rebalancing, in which the investor shifts assets from well performing asset classes to those less favoured. This is a good way of controlling risk without necessarily trying to time the market.
A third option is that there is nothing wrong with investors taking into account the returns they have already enjoyed and adjusting their asset allocations if they are on course to meet their goals. So, for example, for some investors it might make perfect sense to lock in returns after a good period and put the money into short-term fixed income if that meets their needs.
Yet another option is dollar-cost averaging. This is a method where an individual invests small amounts of an available pool of cash into the market over a period, rather than investing a lump sum in one go.
A useful contribution on this subject comes from Ken French, Professor of Finance at the Tuck School of Business at Dartmouth College. In his role as an academic, Professor French says the optimal decision is to invest it all at once. But while this might give an individual the best investment outcome, he says it might not be the best investment experience.4
This is because people tend to feel regret more strongly when it results from things they did do than from things they did not. So, for instance, it feels much more painful to buy stocks now and see the price go down than it is to neglect to buy stocks and the price goes up.
Professor French says that by dollar cost averaging, people can diversify their “acts of commission” (the stuff they did do) as opposed to their “acts of omission” (the stuff they didn’t do).
“The nice thing is that even if I put my finance professor hat back on, it’s really not that damaging to your long-term portfolio to just spread it out over three or four months,” he says. “So if you as an investor find that’s much more tolerable for you, you’re not really doing much harm.”
So, in summary, it’s always difficult to choose exactly the right time to get into or out of the market. For instance, it would have been nice to get out in late 2007 and back in around early March 2009.
But most mortals are unable to finesse it to that degree. The good news is that there are other options than just staying out of the market altogether and plunging back in.
These include maintaining a long-term strategic asset allocation in the first place, periodically rebalancing, taking money off the table if retirement goals are on track and dollar-cost averaging if that provides comfort.