Emerging markets may struggle to repeat 2017’s golden year

When hedge fund legend Howard Marks from Oaktree Capital wrote a book on investing he devoted a chapter to the importance of being attentive to cycles. Marks said he lived by a rule that most things would prove to be cyclical. He went on to say that some of the greatest opportunities for gain and loss would occur when other people forgot this rule. This message could well be applied in 2018 to emerging markets, where stock markets have delivered extraordinary gains on the back of a cyclical upswing in earnings. The earnings growth of 24 per cent in emerging markets was fuelled by strong domestic economic growth and favourable exports. Data shows that Asia had some of the strongest-performing stock markets in world in 2017 with emerging market economies Vietnam, India, Philippines, Malaysia and Indonesia leading the pack.

Retail and institutional investors obviously felt good about the prospects for companies in emerging markets last year, judging from the data showing total inflows of $US85.5 billion in 2017. But when you combine the funds flow data with the latest outlook for emerging market earnings there are reasons to be cautious, according to Jonathan Garner, chief Asia and emerging market strategist at Morgan Stanley. He echoes Marks when he says investors need to be aware that economic and earnings cycles are turning. First, he notes that the cumulative number of positive weekly fund flows into dedicated emerging market funds (ex-China A-share funds) in the 10 weeks leading up to the end of the 2017 was the strongest since 2010.

Slower earnings forecast

He says that when you match the flows up against the Morgan Stanley base case for 2018 earnings for companies in the MSCI Emerging Markets Index there is reason to be cautious. Asian countries included in the MSCI EM Index include China, India, Indonesia, Malaysia, Philippines, Taiwan and Thailand. Countries outside of Asia include Russia, Brazil, Turkey, Colombia, Egypt, Greece, Poland, Mexico, Peru, South Africa, the UAE and Qatar. Garner says earnings for companies in the MSCI EM Index are forecast to more than halve this year. Earnings were 24 per cent in 2017 and are forecast to be 11 per cent in 2018 and 7 per cent in 2019. The strong earnings in 2017 help explain why the MSCI EM Index rose 36 per cent over the past 12 months.

One of the big reasons for the earnings drop in 2018 is because of the end to the bullish global cycles for NAND and DRAM memory chips. Morgan Stanley says these cycles will turn in 2018 because of oversupply. Both products have been in upward cycles since January 2016. The IT sector makes up about 28 per cent of the MSCI EM Index compared to about 16 per cent for the MSCI World Index. A sell-off in IT stocks in emerging markets that began in November has abated. Another valuation measure that Garner says is sending an amber warning signal is the price to sales ratio for emerging market stocks. This ratio is calculated by dividing the company’s market cap by the revenue in the most recent year.

Turning cycles

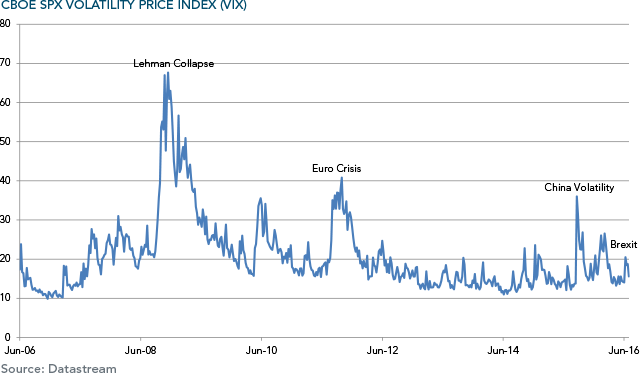
Garner says the price-to-sales ratio for emerging market stocks in the Asia-Pacific ex-Japan and ex-financials is higher than the 90th percentile relative to their 20-year history. The most interesting aspect of this analysis is to look at what happened to the performance of stocks when the cycle turned. The four previous high average price to-sale ratios were between December 1993 and September 1997 (1.8), December 1999 and September 2000 (1.6), September 2007 and May 2008 (1.75) and December 2010 and January 2011 (1.41). In the subsequent four years after the May 2008 peak the index fell 4.5 per cent. After other peaks it fell 2.5 per cent and 1.5 per cent and on one occasion rose 1.3 per cent. The message is that the turn in the cycle could lead to sub-par returns in the years ahead. Other reasons for caution are the higher oil price, which tends to hurt emerging markets more than developed markets, the low volatility as measured by the VIX.

Index, the buoyant IPO market in Asia and the low spreads between high-risk and low-risk bonds in the US market. Nevertheless, Garner and his colleagues in the Morgan Stanley equity strategy team in Hong Kong do recommend being overweight China, Brazil and India. They recommend being underweight Indonesia and Korea. The turn in the cycle in the oil market should be positive for energy stocks. The gap between price to book and price to sales ratios for semi-conductor manufacturers/tech hardware stocks and energy is at an all time high. But that should change in 2018. 

Decelerating Chinese growth 

Another cycle that has turned is the Chinese economic growth cycle, according to Garner. He says this is clear from the recent movements in the proprietary Morgan Stanley China Economic Index, which tracks electricity production, car sales, steel production, fiscal expenditure, real exports and real imports. Other economists predicting a deceleration in China’s GDP growth include Shuang Ding, the chief economist, Greater China and North Asia at Standard Chartered Bank. He has five key predictions for 2018. First, he says growth will decelerate to 6.5 per cent from an estimated 6.8 per cent in 2017 as the government pursues deleveraging and aims to reduce pollution. Second, CPI inflation will surprise on the upside at 2.7 per cent. Third, the People’s Bank of China will raise monetary operation rates by a total of 20bps, following the trend of monetary policy normalisation by major central banks. Fourth, the USD-CNY will reach 6.45 by end-2018, based on his assumption of a weakening US dollar. Finally, the debt-to-GDP ratio will continue to rise, but at a slow pace. The debt ratio is forecast to hit 277 per cent by the end of 2018, versus an estimated 270 per cent at the end of 2017.

Where to look

Those investors wanting to confirm their bullish bias toward Asian stocks should read the latest forecasts from HSBC for emerging markets and the buy recommendations from Japanese broker Nomura for the Philippines. Nomura is one of the few international brokers with a strong presence in the Philippines. Nomura says share price performance in the Philippines will depend upon earnings growth of about 13 per cent across the market in 2018. It is bullish in relation to Philippine banks, consumer discretionary, industrials and property sectors. Earnings growth for some of its buy recommended stocks are as high as 32 per cent and yet price earnings multiples are in the mid-teens. The consensus is that India will have the fastest-growing economy in Asia in 2018, which continues an upward cycle kicked off by the election of Narendra Modi in 2014. Garner at Morgan Stanley says the world’s institutional investors are overweight India but much less than they have been over the past few years. He expects real GDP growth to accelerate to 7.5 per cent in 2018 and further to 7.7 per cent in 2019, from 6.4 per cent in 2017.

“More importantly, we are confident that a recovery in private capex will be under way in 2018, for the first time in six years,” he says. Now that is a positive cycle to watch. Marks says that ignoring cycles and extrapolating trends are the most dangerous things investors can do.

Two Valuable Lessons for Young Investors

I was recently asked to put some thoughts together for investing newsletter Cuffelinks on what advice I would give my 20 year-old self.

Thinking about this reminded me that becoming a better investor is an iterative process that occurs over many years. The only way we can improve as investors is if we learn new things as we go, likely making valuable (and potentially costly) mistakes along the way which help us accumulate greater knowledge and form better financial habits.

Unfortunately there are no do-overs when it comes to investing, and so it is with that in mind that I think about two pieces of enduring investment advice I would give my younger self.

Don’t overrate your abilities

The first thing that comes to mind when I think about my 20 year-old self is overconfidence – specifically overconfidence in my ability to beat the market. My early personal investments were concentrated in a handful of stocks, which all ended up being poor performers relative to the broad market. One of those, a US airline, even went bankrupt soon after, which was a big wake-up call.

After twenty years’ experience in investment management, I would tell my younger self how challenging it is, even for professional investors, to consistently beat the market. I certainly became a better investor once I grasped the awesome power of diversification.

Contribute early and often to make the most of compounding

Compounding really is the most powerful savings tool at our disposal. When I log into my Vanguard 401(k) portal in the US, I can see that over 20 years of saving, about half of my savings balance is from investment returns. The other half is made up of my contributions over the years.

While I have been able to contribute more over the last 10 years than the decade before that, it is those early dollars I was able to save in my 20s that have had the most impact on returns through compounding over time.

Although retirement seemed a long way off back then – and it still does today – I would be in a far better position today if I had made fewer silly purchases and put just a little extra down when I was younger.

I also would have told my 20 year-old self not to buy that Honda Prelude. This compact sports car was uncomfortable to drive on my long commute to work and the mileage wasn’t great. I should have bought the Civic, which was significantly cheaper and more practical, and then tipped the money I would have saved into my Vanguard retirement account.

Originally posted on 16th May 2017 at https://www.vanguardinvestments.com.au authored by By Rodney Comegys, Vanguard Head of Investments, Asia-Pacific

Can you beat the Market?

The Active vs Passive Debate

Australian Private Capital, over many years has observed that ‘Passive’ investment management tends to deliver a better long term return than ‘Active’ investment management. But why?……

Daniel Kahneman, Professor of Psychology at Princeton and winner of the 2002 Nobel Prize in economics probably said it best. “The idea that any single individual without extra information or extra market power can beat the market is highly unlikely. Yet the market is full of people who think they can do it and full of other people who believe them. This is one of the great mysteries of finance. Why do people believe they can do the impossible and why do others believe them?”

How about Warren?

Another interesting perspective comes from Warren Buffett who has made the point many times that high turnover, expensive managed funds (such as hedge funds) would under-perform relative to low cost, simple passive index funds over a long-time period. Warren Buffett has taunted hedge fund managers, saying that a simple low cost index fund (e.g. the S&P500 ETF) would perform better over the long run (10 yrs) than more expensive hedge funds. In fact he challenged anyone to take a bet with him that this would be the case. Buffett expected a parade of fund managers to come forward and take the bet… and “defend their occupation”. What followed was “the sound of silence”. One manager finally came forward and made a $500,000 bet with Buffett. Ted Seiders of Protégé Partners, selected a basket of 5 hedge funds to compete against Buffett’s choice, the Vanguard S&P500 ETF over a 10-year period. The bet began on 1 January 2008 and is now into its 9th year. And the results have been very interesting as the table below outlines:

The returns from the simple passive index fund have significantly outperformed the hedge funds. A $1million dollar investment in the basket of hedge funds would be worth around $1.22mill now, while an investment in the Vanguard S&P500 fund would be worth around $1.85m.

The SPIVA Report

Annually the SPIVA report is published comparing Active and Passive investment strategy performance.  A high level summary to 31st December 2016 comparing Active manager’s performance against their chosen benchmark after fees over 1, 3, 5 and 10 years respectively illustrates Professor Kahneman’s point.

      1. 86%, 94%, 93% and 89% of Global Equity managers underperformed
      2. 76%, 67%, 70% and 74% of Australian General equity managers underperformed
      3. 82%, 62%, 48% and 33% of Australian Small/Mid cap managers underperformed
      4. 63%, 90%, 77%, and 88% of Australian bond managers underperformed
      5. 77%, 93%, 83%, and 77% of A-REIT managers underperformed

The full report can be downloaded here.

Can you know which sector will shine, before the dawn?

It is difficult to see how one could know which sectors will do best relative to others sectors when you look at the following table.  Each sector has its own colour (the second table) and the performance from best to worst is arranged top to bottom (the first table).  To suggest there is a pattern is a real stretch! 

So, can you beat the market?

Evidence over long periods of time suggest the answer is yes, by taking a semi-passive investment approach and keeping investment costs low.  By semi-passive, what APC means is structuring your portfolio to tilt to the sectors which we know, from evidence, do better than the overall market.

Academic research has identified these sectors of securities that have delivered higher returns (or premiums) over time. These premiums may be positive or negative in any given year.  Over longer periods, historically the expectation of positive premiums increases. Structuring your portfolio to target these sectors helps increase the reliability of outcomes.

So what are these sectors?

Company Size

Smaller companies tend to deliver a superior return over larger companies over the long term.  This is because Risk and Return are related. However it is important to understand they don’t consistently deliver this premium, but if you take a long term approach, tilting your portfolio to this sector will reward the patient investor.

Relative Book-to-Market Value

Often called a ‘Value’ stock, this is where a company’s market value (ie number of shares multiplied by the share price) is lower than its book value (ie the value the accountants give the company). Value stocks have tended to outperform Growth stocks over time, though not all the time. However in the competitive ‘listed company’ world, relative underperformance to peers is not generally tolerated for long.  Either the management’s strategy changes or the management changes!  This tends to lead to a ‘re-rating’ of such ‘Value’ stocks, and the price generally goes up.

Profitable companies

It may sound obvious but a more profitable company tends to deliver superior returns when compared to a less profitable company in share price terms.

How have these sectors performed relative over time?

Australian Shares

U.S. Stocks

Developed World – Ex U.S Stocks

Emerging Markets


As you can see from the tables above, these premia are observable across all markets over long periods of time.  By ‘tilting’ a portfolio to these sectors you increase the probability that over time you will obtain a superior return to the market generally.

Australian Private Capital has implemented this philosophy over many years, obtaining for our clients returns that are superior to the market.  Our portfolios are low cost and low trading which enhances after tax returns.

If you have any further questions about APC’s investment philosophy feel free to make contact with a member of our advisory team.

A Focus on Trump Trades

US Market Reaction – Insights

Markets completely got the US Presidential election result wrong, but ended up with good gains nonetheless. The view was that “Trump should not win, but if he does markets will tank.” As it turned out, Trump won but the market melt-down lasted only a few hours – with Trump’s less belligerent victory speech quickly soothing market fears, and enabling the Dow Jones to reach a new record high. The focus now is the extent to which “post-election Trump” will be more responsible in approach than the “pre-election Trump”.

In terms of Trump’s economic policies, markets are particularly excited about fiscal stimulus through tax cuts and increased spending on defence and infrastructure (including that wall!). This is helping construction and defence related stocks on Wall Street. Trumps’ other economic policy, reduced regulation, is also bullish for financial and health care stocks. The prospect of increased US fiscal stimulus is bullish for the USD and will add to upward pressure on bond yields. Apart from post-Trump sector rotation opportunities (as noted above), US equities overall remain challenged by still-high valuations and sluggish corporate earnings. Any possible boost to economic growth and earnings from fiscal stimulus needs to be counter-balanced with the likely added upward pressure on bond yields and inflation. Indeed, it should not be forgotten that the US economy already has a fairly tight labour market, as evident with a now clear upward trend in wages growth.

Australian Market Reaction – Insights

The “Trump trade” was also reflected in local markets, with the S&P/ASX 200 up nicely and bonds being dumped. Trump’s victory, along with China’s high PPI result, also provided another excuse for iron ore prices to rally further! Despite the recent changes and market performance nothing is likely to change the outlook for interest rates, with attention focused on the US and Trump.

All up, to the extent Trump’s victory is bullish for the US economy and the $US, it reduces at the margin the chances of a further RBA rate cut in 2017. Key market themes remain, sensitivity of local defensive yield plays (like listed property) in light of higher bonds yields, and a rotation toward financials for those still seeking yield. Resources remain bullish, but I remain skeptical of the sustainability of the recent surge in iron ore and coal prices and remain wary that “too much too soon” goods news has already been priced into the sector.

Article sourced from BetaShares economist David Bassanese published Dec 2016

Most Fundies Can’t beat the Index, but playing the long game helps

Sixty percent of large cap managers failed to beat the index over the past year according to the 2016 mid-year review by Dow Jones of active versus passive investing, while over five years almost 70 per cent of managers couldn’t match the major index.

The results were better if investors had given their money to a small or mid-cap manager. Although just over 61 per cent failed to beat their benchmark index over a year there was some good news if investors allowed them more time to generate returns.

Over a five year time frame about 62 per cent of fund managers in small and mid-caps did better than the index. Small and Mid-Cap stocks have been fertile ground for investors looking for growth over the past few years with the poor performance of the four major banks and miners such as BHP Billiton and Rio Tinto dragging down the large cap index.

The worst performance, however, came from active managers of global shares, bonds and property trusts with more than 8 out of 10 funds across all three asset classes failing to do better than their relevant benchmark index.

How does this relate to your portfolio?

Australian Private Capital’s patient strategic asset allocation approach to portfolio management lowers costs through reducing trading costs, maximising the use of the 50% capital gains tax discount and where prudent, using franking credits to the investor’s advantage.  These aspects of our philosophy are designed to improve net rates of investment return over the long term.  Another benefit of this approach is the capturing of small company and value company sector returns that are better than the broader market,  when they occur.  As the table below illustrates, when specific sectors ‘have their time in the sun’, it usually happens quickly.  Therefore by applying a patient approach to portfolio management, rather than trying to ‘time markets’ or ‘pick the winners’, will tend to reward the investor over time.


Category 6 Months 1 Year 3 Years
S&P ASX 300 Index (Total Return) 10.43% 11.79% 6.57%
Australian Large Companies 11.79% 12.92% 7.10%
Australian Value Companies 23.49% 28.92% 8.54%
Australian Small Companies 8.73% 14.58% 6.24%


President Trump could be good for the economy

Reserve Bank governor Philip Lowe has predicted some of the Trump administration’s economic policies could be good for Australia and the global economy, while warning it could also turn out “very badly” if America retreats from the international order of the world.

In answers to questions following his first public address of the year, opening the A50 forum of leading international fund managers in Sydney, Dr Lowe said the RBA “was in watch and wait mode like everyone else” with the US administration. “It’s very difficult to predict how the new US administration is going to effect economic policies,” he said. “It’s quite possible that the outcomes are really good. Increased spending on infrastructure, reducing regulation, cutting corporate tax, are things that the G20 have been calling for to stimulate economic growth. “To some degree that is at the core of President Trump’s political message, if that works it could be really good for global growth.” It was these policies that Dr Lowe also urged the federal government in Australia to follow.

But he also delivered a blunt economic warning to the audience of policymakers and fund managers. “It could turn out very badly though if we do see the retreat from the open international order, the US economy would be weaker and the world economy would be weaker,” he said. “It surely can’t be the case that the way to build prosperity is to build barriers between each other.” 

In what appeared to be a swipe at developments in the United States Dr Lowe used his address to point out that Australia offered international investors “an openness and transparency not always seen elsewhere around the world”. “Australia has benefited greatly from the open international trading system,” he said. Year after year, for more than two centuries now, capital from the rest of the world has helped build our country. As investors, Australians have also benefited from being able to diversify our portfolios.”

While not commenting specifically on President Donald Trump’s migration bans that have caused turmoil in the United States and debate around the world, Dr Lowe highlighted the benefits of a dynamic migrant population to the Australian economy. “Our population has recently been growing at around 1.5 per cent a year, and around 40 per cent of us were either born overseas or have one parent born overseas,” he said. “This brings a dynamism that isn’t there in countries with stagnant and less diverse populations.”

In the address, Dr Lowe delivered an upbeat assessment of the Australian economy but implored Prime Minister Malcolm Turnbull to borrow more to spend on roads, railways and other infrastructure. Dr Lowe said while it was important for the government to rebuild its finances, that shouldn’t stop it borrowing to build the high-quality infrastructure it will need to maintain support for a growing population. “Good transport infrastructure opens up opportunities for people and opens markets. Investment in transportation infrastructure can also play an important role in addressing housing affordability,” he said. “Infrastructure investment does of course need to be paid for. The positive news here is that there is no shortage of finance for the right projects.”

His comments echo those of his predecessor Glenn Stevens, who said public investment in infrastructure could boost the economy, making the Reserve Bank’s job easier while lifting Australia’s productive capacity.

Tax cuts call

The government’s day-to-day budget would need to move closer to balance in order to give Australia headroom to deal with shocks. A “complication” was the need to make Australia’s tax system competitive. “One example of this complication is in the area of corporate tax, where there is a form of international tax competition going on in an effort to attract foreign investment,” Dr Lowe said. “Like other countries, we face the challenge of responding to this while achieving a balance between recurrent spending and fiscal revenue.”

An update of Reserve Bank forecasts released last Friday predicted economic growth of around 3 per cent in each of the next two years, boosted by a significant pick-up in liquefied natural gas exports, understood to account for around 0.5 points of growth each year, he said. The economic headwinds from the unwinding of the mining investment boom would “blow themselves out” as 90 per cent of the slide had already happened and Australia’s terms of trade had stabilised.

Housing presented a “complex picture” with investor demand strengthening and prices in Sydney and Melbourne climbing strongly, while apartment prices in other cities were falling. Although household debt was high, taken together households were “coping reasonably well”.

Article sourced from the Canberra Times via MSN Money published 10/02/2017

Thinking Small

Every night on the TV finance news, you’ll hear about the ups and downs of household name stocks, like the big four banks, Telstra, CSL, Wesfarmers, Woolworths, BHP Billiton and Rio Tinto. But the market is more than that handful of names.

There are about 500 stocks in the All Ordinaries index, the indicator often referred to in the media as the benchmark for the Australian share market. The combined market value of all those stocks, as of August 2016, was close to $1.8 trillion.

Large cap stocks, such as the big stocks mentioned above, make up about 80-85% of the total market cap. Currently, these are roughly the largest 100 stocks by size. The remaining 15-20% of the market cap is represented by the small company stocks.

So why would you want to include these often obscure companies in your portfolio? Well, there are a couple of reasons. One is that these stocks (known as ‘small caps’) tend to behave differently to the better known larger names otherwise known as large caps.

Sometimes, large caps will be the best performers. Other times, small caps will be in favour. So owning both parts of the market means you are getting a diversification benefit. In other words, some of the volatility of being exposed to just one part of the market is reduced.

A second reason for owning small caps in a diversified portfolio is that they are expected to earn a premium over large company stocks. Research shows this small cap premium (alongside premiums from low relative price and highly profitable stocks) is persistent across time and pervasive across different markets around the world.

There are a few provisos to this finding. One is that the premiums are not there every day, every month or even every year. While we expect them to be there every day, there are periods when small caps will underperform large caps. This makes sense because if the premium was there all the time, it would be traded away.

A second caution is that within small caps, other premiums are at play. Research shows that among small stocks, those with high relative prices (sometimes known as ‘growth’ stocks) and lower profitability tend to have significantly lower expected returns than the rest. That means we need to take into account this difference in expected returns.

Finally, diversification is critical. Over shorter periods, some stocks may do exceptionally well; others exceptionally poorly. It’s difficult to identify these stocks in advance. And that’s why you need a well-diversified portfolio that can capture the performance of these stocks in a more consistent manner. Diversification also helps control implementation costs which if unmanaged can be quite high for small cap stocks.

So what’s been the long-term evidence of a small cap premium in Australia? Over nearly four decades to the end of 2015, small caps here delivered annualised returns of nearly 14%, beating large caps by around two percentage points per annum on average.1

The tricky thing for investors is the “on average” bit. In some years, such as 1989, small caps significantly underperformed large caps. In other years, such as in 1993, small caps shot the lights out, figuratively speaking.

Indeed, over the four-decade period shown in the chart below, you can see that only in four years has the performance of small cap stocks been within 2% of that average premium. So the small cap premium (the difference between the performance of large and small cap stocks) can be volatile, which is the price you pay for earning the premium.


In recent years, Australian small company stocks have struggled. In fact, in the four years from 2011-2014 inclusive, the small cap premium (as shown above) was negative.

But does that give us any information about the future performance of small cap stocks or what might drive the performance in the years ahead?

In other words, can we time the premiums available from small, low relative price and more profitable stocks? It would be nice, wouldn’t it? But rigorous tests show very limited evidence that we could do so reliably. That’s the bad news.

The good news is you don’t need to be a timing wizard to get the benefit of these premiums. We’ve seen they are there over the long term. And we know that the best way to capture them is to apply a consistent focus within a broadly diversified portfolio.

The nature of the small cap premium, however, is that when it does kick in, it can do so with a vengeance.

And that’s precisely what we have seen in the past 12 months to the end of July 2016 as small caps (as measured by the same index as in the above chart) have delivered a return of about 18% in the Australian market, well north of the flat result from large cap stocks.2

So the big glamour stocks are not all that there is to our market. Small cap stocks also play an important role in your portfolio. They provide a diversification benefit because they behave differently to those big names. But they also offer an expected premium over time.

The trick is riding out the volatility and staying disciplined within the asset allocation of your Classic portfolio.

It’s a small world after all.

Pokémon Investing

Have you noticed the surge recently in people wandering aimlessly and staring at their smartphones? Chances are they’re playing Pokémon GO, the latest craze. It’s an activity eerily close to how some folk see investing.

From Tokyo to Frankfurt and from New York to Sydney, tens of millions of people have become obsessed with finding tiny virtual creatures called Pokémon, using their smartphones’ camera and global positioning systems.

Such is the addictive nature of Pokémon GO that some people have been caught playing the game while driving. Two men in the US were reported to have fallen off a cliff in their search for Pokémon. Others have been hit by cars.1

The blinkered and single-minded behaviour evident in those hunting Pokémon can also be seen in people who build portfolios around individual securities. And while you won’t get run over, you can still do yourself a lot of damage this way.

Stock pickers tend to concentrate their portfolios around what they see as their best ideas. They will focus on stocks which they believe the market has mispriced and buy them in the hope the market will come around to their view eventually.

Of course, there are a few problems with this approach. Like Pokémon players so focused on their phones that they miss a spectacular sunset (or worse lose their jobs!), stock pickers can be so intent on finding the right stock that they overlook the opportunity cost of missing out on the market return.

A narrow focus also leaves the stock hunter open to idiosyncratic risks associated with single companies or sectors, risks that can be offset by keeping your portfolio broadly diversified.

The Pokémon addict who walks in front of a truck is like the stock picker who stakes everything on a security that crashes his portfolio. The risk isn’t just that his stock bets fail to pay off, but that he fails to earn the market returns owed to him and falls short of his medium-term and long-term financial goals.

Another issue is cost. It may be diverting to spend your lunch hour chasing after digital “creatures”, but you could also have spent that time reading or catching up with friends or going to the gym to get healthy. Likewise, stock pickers have to factor in the costs of brokerage, time and stress related to betting against the market.

The question you have to ask is whether the considerable risks you are taking are worth the possible benefit. Keep in mind that surveys consistently show that over time only a small fraction of stock picking managers outperform the market after fees. And even then, it is very difficult to identify the winners in advance.2

As for individual stock recommendations, you don’t have to go far to find examples of investor guidance that turn out to be the share market equivalent of someone following an imagined Pokémon over a cliff.

In March, 2015, one Australian media outlet noted that consumer electronics retailer Dick Smith Holdings Ltd had “jumped to the top of a number of analysts’ buy lists” after it reported strong first half earnings and flagged buoyant sales.3

At that point, the stock was trading at around $2 a share. By the end of that year, it had fallen to 35 cents. In January 2016, the company collapsed and was placed in receivership. All of its 363 stores in Australia and New Zealand were closed and more than two thousand people lost their jobs.

Now, the analyst calls on Dick Smith at the time might have seemed perfectly reasonable given the information to hand. Their perceived “fair price” for the security was well above $2 and this would have been a profitable trade had they been right.

But the analysts turned out to be wrong. Basing investment performance on identifying a “mispriced” security did not work in this case.

In other cases, of course, analysts will have got it right. But a lot of things have to fall into place for this to be a consistently winning strategy. Not only does the market have to come around to your price, you have to ensure that costs don’t outweigh the premium you earn. And even if you meet those requirements, some new piece of information might still move the price in the opposite direction of your forecast.

The fact is prices change as information changes. Unless you have a crystal ball, it seems highly unlikely that you’ll find all the market Pokémon without doing yourself some damage in the process.

A better approach is to work on the basis that current prices are fair. Instead of second guessing prices, you use the information they contain to build highly diversified portfolios that pursue higher expected returns while minimising idiosyncratic risks and avoiding unnecessary costs.

Of course, using this approach does not eliminate risk. And there will be times when you won’t be compensated. But you can be confident that there is a sensible explanation for this way of investing, that the desired premiums are persistent and pervasive and that you can capture them cost effectively.

Pokémon Go is not all bad. But to borrow its slogan, “you gotta catch ’em all”.

Diversification Counts when Uncertainty Beckons

It is a good time to take a simple temperature check.

Pick the option that best describes your attitude to investing today:

A – confident
B – fearful
C – uncertain
D – all of the above

Economic messages and market signals blended with dramatic and tragic geo-political events are presenting investors with lots of conflicting information to digest.

The Brexit vote understandably unsettled markets while the glacial-like counting in our federal election added its own sense of uncertainty. Then came the tragedy and drama of events in France and Turkey over the weekend that added an emotional and human perspective.

Back home a range of research reports made media headlines forecasting falling or flat residential property prices in major cities – the traditional safe harbor of Australian investors.

In the midst of all this an industry colleague was questioning the role of another traditional investing safe harbor – fixed income.

The question is both valid and topical. It is hard to get excited about an investment where return forecasts around the globe are close to zero.

But when information is overloading you with mixed, at times opposing signals – the US sharemarket hit a new record high last week in case you hadn’t noticed – that is as good a time as any to go back to first principles.

Vanguard has enjoyed success in 20 years in the Australian market based on four basic principles that guide the investment approach. Developing a balanced asset allocation using broadly diversified funds is at the heart of the approach.

That importantly incorporates fixed income as a key part of the asset allocation mix.

Vanguard’s Global chief economist Joe Davis wrote in a recent blog that to build a multi-asset-class portfolio appropriate to a given goal and risk preference depends, primarily, on the following three characteristics of each asset:

  • its expected return
  • the expected volatility of those returns
  • the correlation of the asset’s return with those of other assets (i.e., its covariance)

Around the globe yields on government bonds are extremely low. So does that mean investors need to look elsewhere? Return is obviously a key measure of any investment but critically it should not be the only measure.

Why do investors buy US government bonds yielding less than 2 per cent and even with negative yields in other markets? Certainty is the answer. As one wag of a portfolio manager quipped recently – zero is a lot better than minus 20 per cent or 30 per cent.

One of the key principles of diversification is finding assets that are not correlated to other parts of the portfolio. When shares zig bonds usually zag which is the intrinsic value of bond holdings in a portfolio. So for investors bonds are really the defensive side of the equation.

A basic but important factor in building a diversified portfolio is to have assets within it that are not highly correlated and will not move in lockstep with a major asset class like local and international sharemarkets.

Vanguard’s Investment Strategy Group has looked at the correlation levels between 10-year Australian Government bonds and the Australian sharemarket. When you look back to the late 1990s there was a positive correlation between bonds and shares. Since the global financial crisis in 2008 the correlation has remained in negative territory.

So despite the low yields on offer the diversification power of government bonds and fixed income remains as strong as it has ever been.

History on the Run

When news breaks and markets move, content-starved media often invite talking heads to muse on the repercussions. Knowing the difference between this speculative opinion and actual facts can help investors keep their nerve.

At the end of June, UK citizens voted in a referendum for the nation to withdraw from the European Union. The result, which defied the expectations of many, led to market volatility as participants weighed up possible consequences.

Reporting on the result, The Washington Post said the vote had “escalated the risk of global recession, plunged financial markets into freefall and tested the strength of safeguards since the last downturn seven years ago”.1

The Financial Times said ‘Brexit’ had the makings of a global crisis. “(This) represents a wider threat to the global economy and the broader international political system,” the paper said. “The consequences will be felt across the world.”2

Now it is true there have been political repercussions from the Brexit vote. Teresa May replaced David Cameron as Britain’s prime minister and overhauled the cabinet. There are debates in Europe about how the withdrawal will be managed and the possible consequences for other EU members.

But markets have functioned normally. Indeed, within a few weeks of the UK vote, Britain’s top share index, the FTSE 100, hit 11-month highs. By mid-July the US S&P 500 and Dow Jones industrial average had risen to record highs. Shares in Europe and Asia also strengthened after dipping initially on the vote.

On currency markets, the pound sterling fell to a 35-year low against the US dollar in early July. The Bank of England later surprised forecasters by leaving official interest rates on hold.

Yes, the Brexit vote did lead to initial volatility in markets, but this has not been exceptional or out of the ordinary. One widely viewed barometer is the Chicago Board Options Exchange’s volatility index or ‘VIX’. Using S&P 500 stock index options, this index measures market expectations of near-term volatility.

2016_CBOE_SPX_Volatility_Price_Index

You can see by the chart above that while there was a slight rise in volatility around the Brexit result, it was insignificant relative to other major events of recent years, including the collapse of Lehman Brothers, the Euro Zone crisis of 2011 and the severe volatility in the Chinese domestic equity market in 2015.

None of this is intended to downplay the political and economic difficulties of Britain leaving the European Union, but it does illustrate the dangers of trying to second guess markets and base a long-term investment strategy on speculation.

Another recent example of this tendency came shortly after the Brexit vote, in the Australian general election, where a much closer-than-expected result sparked media speculation of severe economic and market implications.

In the Sydney Morning Herald, journalists said Australia faced a “protracted political and constitutional crisis”, leaving spooked financial markets on edge, investment stalled and the country’s credit rating on the brink of a downgrade.3

By the end of the first day after the vote, however, Reuters reported that Australian shares had risen as “surging commodity prices” overrode political uncertainty. After a brief blip, the Australian dollar rebounded to where it was before the poll.4

A week later, late counting in the most marginal constituencies gave the incumbent Liberal-National Party Coalition the barest majority in the House of Representatives, allowing them to form a government.

Now the focus of speculation has turned to how markets might respond to the US presidential election. CNBC recently reported that surveys from Wall Street investment firms showed “growing concern” over how the race might play out.5

Given the examples above, would you be wagering your portfolio on this sort of speculation, particularly when it comes from the same people who pronounced on Brexit? And remember, not only must you correctly forecast the outcome of the vote you have to correctly guess how the market will react.

And think about this. Even if you do get it right, what’s to say some other event might steal the markets’ attention in the meantime? The world is complex and unpredictable. No-one really can be certain about anything.

What we do know is that markets incorporate news instantaneously and that your best protection against volatility is to diversify both across and within asset classes, while remaining focused on how you are tracking relative to your own goals.

The danger of investing based on what just happened is that the situation can change by the time you act, a “crisis” can morph into something far less dramatic and you end up responding to news that is already in the price.

Journalism is often described as writing history on the run. Don’t get caught investing the same way.