Test 123
,pkl nojhnbjh
ninjiu
mijnij
Test 123
,pkl nojhnbjh
ninjiu
mijnij
Test 123
,pkl nojhnbjh
ninjiu
mijnij
Test 123
,pkl nojhnbjh
ninjiu
mijnij
Test 123
,pkl nojhnbjh
ninjiu
mijnij
Company
Values
Our Service
Who is APC best suited to help?
Our Approach
Test 123
,pkl nojhnbjh
ninjiu
mijnij
Test 123
,pkl nojhnbjh
ninjiu
mijnij
Test 123
,pkl nojhnbjh
ninjiu
mijnij
Test 123
,pkl nojhnbjh
ninjiu
mijnij
Test 123
,pkl nojhnbjh
ninjiu
mijnij
From Tokyo to Frankfurt and from New York to Sydney, tens of millions of people have become obsessed with finding tiny virtual creatures called Pokémon, using their smartphones’ camera and global positioning systems.
Such is the addictive nature of Pokémon GO that some people have been caught playing the game while driving. Two men in the US were reported to have fallen off a cliff in their search for Pokémon. Others have been hit by cars.1
The blinkered and single-minded behaviour evident in those hunting Pokémon can also be seen in people who build portfolios around individual securities. And while you won’t get run over, you can still do yourself a lot of damage this way.
Stock pickers tend to concentrate their portfolios around what they see as their best ideas. They will focus on stocks which they believe the market has mispriced and buy them in the hope the market will come around to their view eventually.
Of course, there are a few problems with this approach. Like Pokémon players so focused on their phones that they miss a spectacular sunset (or worse lose their jobs!), stock pickers can be so intent on finding the right stock that they overlook the opportunity cost of missing out on the market return.
A narrow focus also leaves the stock hunter open to idiosyncratic risks associated with single companies or sectors, risks that can be offset by keeping your portfolio broadly diversified.
The Pokémon addict who walks in front of a truck is like the stock picker who stakes everything on a security that crashes his portfolio. The risk isn’t just that his stock bets fail to pay off, but that he fails to earn the market returns owed to him and falls short of his medium-term and long-term financial goals.
Another issue is cost. It may be diverting to spend your lunch hour chasing after digital “creatures”, but you could also have spent that time reading or catching up with friends or going to the gym to get healthy. Likewise, stock pickers have to factor in the costs of brokerage, time and stress related to betting against the market.
The question you have to ask is whether the considerable risks you are taking are worth the possible benefit. Keep in mind that surveys consistently show that over time only a small fraction of stock picking managers outperform the market after fees. And even then, it is very difficult to identify the winners in advance.2
As for individual stock recommendations, you don’t have to go far to find examples of investor guidance that turn out to be the share market equivalent of someone following an imagined Pokémon over a cliff.
In March, 2015, one Australian media outlet noted that consumer electronics retailer Dick Smith Holdings Ltd had “jumped to the top of a number of analysts’ buy lists” after it reported strong first half earnings and flagged buoyant sales.3
At that point, the stock was trading at around $2 a share. By the end of that year, it had fallen to 35 cents. In January 2016, the company collapsed and was placed in receivership. All of its 363 stores in Australia and New Zealand were closed and more than two thousand people lost their jobs.
Now, the analyst calls on Dick Smith at the time might have seemed perfectly reasonable given the information to hand. Their perceived “fair price” for the security was well above $2 and this would have been a profitable trade had they been right.
But the analysts turned out to be wrong. Basing investment performance on identifying a “mispriced” security did not work in this case.
In other cases, of course, analysts will have got it right. But a lot of things have to fall into place for this to be a consistently winning strategy. Not only does the market have to come around to your price, you have to ensure that costs don’t outweigh the premium you earn. And even if you meet those requirements, some new piece of information might still move the price in the opposite direction of your forecast.
The fact is prices change as information changes. Unless you have a crystal ball, it seems highly unlikely that you’ll find all the market Pokémon without doing yourself some damage in the process.
A better approach is to work on the basis that current prices are fair. Instead of second guessing prices, you use the information they contain to build highly diversified portfolios that pursue higher expected returns while minimising idiosyncratic risks and avoiding unnecessary costs.
Of course, using this approach does not eliminate risk. And there will be times when you won’t be compensated. But you can be confident that there is a sensible explanation for this way of investing, that the desired premiums are persistent and pervasive and that you can capture them cost effectively.
Pokémon Go is not all bad. But to borrow its slogan, “you gotta catch ’em all”.
It is a good time to take a simple temperature check.
Pick the option that best describes your attitude to investing today:
A – confident
B – fearful
C – uncertain
D – all of the above
Economic messages and market signals blended with dramatic and tragic geo-political events are presenting investors with lots of conflicting information to digest.
The Brexit vote understandably unsettled markets while the glacial-like counting in our federal election added its own sense of uncertainty. Then came the tragedy and drama of events in France and Turkey over the weekend that added an emotional and human perspective.
Back home a range of research reports made media headlines forecasting falling or flat residential property prices in major cities – the traditional safe harbor of Australian investors.
In the midst of all this an industry colleague was questioning the role of another traditional investing safe harbor – fixed income.
The question is both valid and topical. It is hard to get excited about an investment where return forecasts around the globe are close to zero.
But when information is overloading you with mixed, at times opposing signals – the US sharemarket hit a new record high last week in case you hadn’t noticed – that is as good a time as any to go back to first principles.
Vanguard has enjoyed success in 20 years in the Australian market based on four basic principles that guide the investment approach. Developing a balanced asset allocation using broadly diversified funds is at the heart of the approach.
That importantly incorporates fixed income as a key part of the asset allocation mix.
Vanguard’s Global chief economist Joe Davis wrote in a recent blog that to build a multi-asset-class portfolio appropriate to a given goal and risk preference depends, primarily, on the following three characteristics of each asset:
Around the globe yields on government bonds are extremely low. So does that mean investors need to look elsewhere? Return is obviously a key measure of any investment but critically it should not be the only measure.
Why do investors buy US government bonds yielding less than 2 per cent and even with negative yields in other markets? Certainty is the answer. As one wag of a portfolio manager quipped recently – zero is a lot better than minus 20 per cent or 30 per cent.
One of the key principles of diversification is finding assets that are not correlated to other parts of the portfolio. When shares zig bonds usually zag which is the intrinsic value of bond holdings in a portfolio. So for investors bonds are really the defensive side of the equation.
A basic but important factor in building a diversified portfolio is to have assets within it that are not highly correlated and will not move in lockstep with a major asset class like local and international sharemarkets.
Vanguard’s Investment Strategy Group has looked at the correlation levels between 10-year Australian Government bonds and the Australian sharemarket. When you look back to the late 1990s there was a positive correlation between bonds and shares. Since the global financial crisis in 2008 the correlation has remained in negative territory.
So despite the low yields on offer the diversification power of government bonds and fixed income remains as strong as it has ever been.
At the end of June, UK citizens voted in a referendum for the nation to withdraw from the European Union. The result, which defied the expectations of many, led to market volatility as participants weighed up possible consequences.
Reporting on the result, The Washington Post said the vote had “escalated the risk of global recession, plunged financial markets into freefall and tested the strength of safeguards since the last downturn seven years ago”.1
The Financial Times said ‘Brexit’ had the makings of a global crisis. “(This) represents a wider threat to the global economy and the broader international political system,” the paper said. “The consequences will be felt across the world.”2
Now it is true there have been political repercussions from the Brexit vote. Teresa May replaced David Cameron as Britain’s prime minister and overhauled the cabinet. There are debates in Europe about how the withdrawal will be managed and the possible consequences for other EU members.
But markets have functioned normally. Indeed, within a few weeks of the UK vote, Britain’s top share index, the FTSE 100, hit 11-month highs. By mid-July the US S&P 500 and Dow Jones industrial average had risen to record highs. Shares in Europe and Asia also strengthened after dipping initially on the vote.
On currency markets, the pound sterling fell to a 35-year low against the US dollar in early July. The Bank of England later surprised forecasters by leaving official interest rates on hold.
Yes, the Brexit vote did lead to initial volatility in markets, but this has not been exceptional or out of the ordinary. One widely viewed barometer is the Chicago Board Options Exchange’s volatility index or ‘VIX’. Using S&P 500 stock index options, this index measures market expectations of near-term volatility.
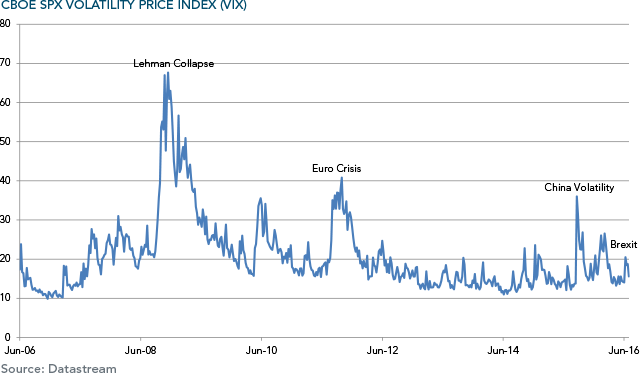
You can see by the chart above that while there was a slight rise in volatility around the Brexit result, it was insignificant relative to other major events of recent years, including the collapse of Lehman Brothers, the Euro Zone crisis of 2011 and the severe volatility in the Chinese domestic equity market in 2015.
None of this is intended to downplay the political and economic difficulties of Britain leaving the European Union, but it does illustrate the dangers of trying to second guess markets and base a long-term investment strategy on speculation.
Another recent example of this tendency came shortly after the Brexit vote, in the Australian general election, where a much closer-than-expected result sparked media speculation of severe economic and market implications.
In the Sydney Morning Herald, journalists said Australia faced a “protracted political and constitutional crisis”, leaving spooked financial markets on edge, investment stalled and the country’s credit rating on the brink of a downgrade.3
By the end of the first day after the vote, however, Reuters reported that Australian shares had risen as “surging commodity prices” overrode political uncertainty. After a brief blip, the Australian dollar rebounded to where it was before the poll.4
A week later, late counting in the most marginal constituencies gave the incumbent Liberal-National Party Coalition the barest majority in the House of Representatives, allowing them to form a government.
Now the focus of speculation has turned to how markets might respond to the US presidential election. CNBC recently reported that surveys from Wall Street investment firms showed “growing concern” over how the race might play out.5
Given the examples above, would you be wagering your portfolio on this sort of speculation, particularly when it comes from the same people who pronounced on Brexit? And remember, not only must you correctly forecast the outcome of the vote you have to correctly guess how the market will react.
And think about this. Even if you do get it right, what’s to say some other event might steal the markets’ attention in the meantime? The world is complex and unpredictable. No-one really can be certain about anything.
What we do know is that markets incorporate news instantaneously and that your best protection against volatility is to diversify both across and within asset classes, while remaining focused on how you are tracking relative to your own goals.
The danger of investing based on what just happened is that the situation can change by the time you act, a “crisis” can morph into something far less dramatic and you end up responding to news that is already in the price.
Journalism is often described as writing history on the run. Don’t get caught investing the same way.
“It promises to be a nervous week for global markets as traders mull over the relative performances of the US presidential candidates. With no clear favourite, the US stock market is unlikely to find any clear direction until the winner is named.”
Does that sound familiar? That line from an article by the Reuters news agency was carried in newspapers around the world. Last week? Last month? No. In fact, that article is from September, 1988 and was about the Bush-Dukakis debates of that year.1
As in the 2016 campaign, that election pitted two non-incumbents against each other as President Reagan completed his requisite two terms. As 1988 began, the New York Times/CBS News Poll talked of a political mood of “drift and uncertainty”.2
This isn’t to imply that every campaign is the same, but it does serve as a reminder that markets regularly navigate political uncertainty. As for supposed “patterns” in election years, research shows 12-month results are strikingly similar to overall averages.3
Of course, the US is not the only country holding national elections or referendums this year. So is Australia, where, again, two party leaders with no experience of leading a campaign are vying for a lower house majority in a race which pollsters say is too close to call.
Prime Minister Malcolm Turnbull, leading the Liberal-National Coalition, and Bill Shorten, leading the opposition Labor Party, are standing on diametrically opposed platforms—the former promising corporate tax cuts and the latter more spending on health and education.
In the Philippines, a new president and self-declared “strongman”, Rodrigo Duterte, has come to power advocating extra-judicial killings to stamp out crime and drugs.
And in the United Kingdom, voters are due on June 23 to cast a ballot in a referendum on whether Britain stays in the 28-member European Union. The UK conservative government has warned voters of a possible recession should they opt for a “Brexit”.
What do all these events mean for equity markets, for government bonds, for commodities and for currencies? Those kinds of questions get a real workout at these times in the financial media, which inevitably finds a wide divergence of opinion from market observers.
While many people will have a keen interest in political outcomes, academic studies show little pattern in actual market returns during US presidential election years. Figure 1 shows the performance of the S&P 500 in 22 US election years dating back to 1928.
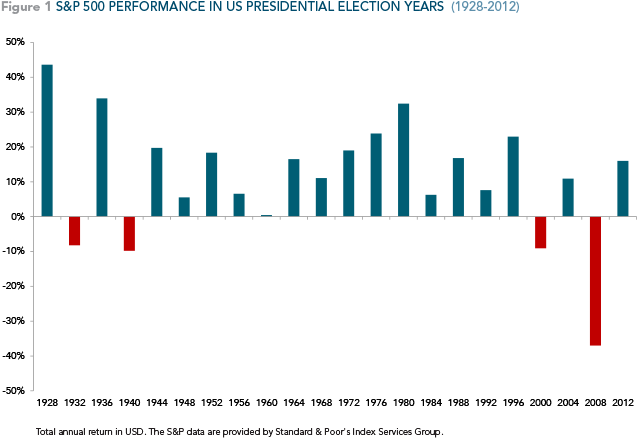
You can see in four of those years, the market fell. In the other 18 instances, it rose. But the truth is this sample size is too small to make any definitive conclusions. And, in any case, it is extremely hard to extract the political from other influences on markets.
For example, the worst annual market outcome during a US presidential year in this sample was 2008 when Democrat contender Barrack Obama defeated Republican nominee John McCain. But if you recall that was also the year of the collapse of Lehman Brothers and the global financial crisis.
Another down year for the market was 2000, the year Republican George W Bush defeated Democrat Al Gore in a tight contest. But that was also the year of the collapse of the bull market in technology stocks, the so-called “tech wreck”.
The point is that any one time markets are being influenced by a myriad of signals and events—economic indicators, earnings news, technological change, trends in consumption and investment, regulatory and policy developments and geopolitical news, to name a few.
So even if you knew ahead of time the outcome of an election in one country, how would you know that events elsewhere would not take greater prominence for the markets?
Keep in mind, also, that elections have a limited range of possible outcomes—a clear win for candidate or party ‘A’ or ‘B’, or an inconclusive result. Markets will adjust ahead of time to deal with risks around these outcomes. And the degree to which they move on the result will often depend on how much it varies from the consensus expectation.
So while we have responsibilities as citizens to take an interest in elections, it is by no means clear that these events have long-term implications for our decisions as investors.
That is much more a matter of our own goals and risk appetites, our investment horizons, the structure of our portfolios, our degree of diversification and the costs we pay.
In the world of information flows, speed is barely an issue anymore. And the old hierarchies, where professionals with state of the art systems had priority access to breaking news, have been progressively dismantled.
For instance, a $500 smartphone with a 1.3 gigahertz processor is more than a thousand times faster than the Apollo guidance computer that sent astronauts to the moon nearly half a century ago. Its internal memory is 250,000 times bigger.
The upshot is that financial and other information comes at us faster and in greater volumes than ever. We no longer have to wait for the six o’clock TV news to know what happened in markets today. Our apps notify us in real time.
But amid this era of always-on news flow, the big question for most of us is not about our access to real-time information; it’s about whether we actually need to be so plugged in to have a successful investment experience.
Dealing with that question starts with reflecting how much of an investment “edge” you get by having access to information that is so freely available.
On that score, there’s an old concept in economics called the law of diminishing returns. It essentially says that adding more and more of one input, while keeping everything else constant, gives you progressively less bang for your buck.
At the industrial end of this technology arms race, you have the high frequency traders who spend a fortune on advanced communications infrastructure to try to take advantage of split second changes in millions of prices. On the evolutionary scale, these computer programs make smart phones look like ploughshares.
So against that background it’s not clear that adding the latest market-minder app to your iPhone is necessarily the path to investment success.
The second question to ask is what you are trying to achieve. Are you trying to “beat” the market by finding mistakes in prices and timing your entry and exit points? If so, and given the competition above, you might want to review your information budget.
The truth for most of us is that investment is not an end in itself, but a means to an end. We want to save for a house or put our children through school or look after aging parents or give ourselves a good chance of a comfortable retirement.
In this context, the most relevant information is about our own lives and circumstances. How much do we spend? How much can we save? What’s our risk appetite? What are our future needs? And how much of a cash buffer do we need?
This is the value an independent financial advisor can bring—not in trying to second-guess the market or using forecasts to gamble with your money—but in understanding the life situation of each person and what each of them needs.
Ultimately, markets are so competitive that we really are wasting our own precious resources by trying to game them. What most of us need is to secure the long-term capital market rates of return as efficiently as possible.
So our limited resource is not speed or access to information, but our own time. We only have a short window to live the lives we want. And that means we should start any investment plan with understanding ourselves.
That’s where the edge is.
The risks that policy change poses to investors were dramatically highlighted by the recent federal budget in Australia, where a cash-strapped government announced the biggest shake-up in superannuation in at least a decade.
The announcement came just hours after another surprise policy change as the Reserve Bank of Australia cut its official cash rate to a record low of 1.75%, citing unexpectedly lower inflation and further signs of an economic slowdown in China.1
In the budget, the government argued it is seeking to better target tax concessions for superannuation and to bring the system in line with its objective of “providing income in retirement to substitute or supplement the age pension”.2
The changes include:
Many of these measures had been well flagged, but the $1.6 million retirement account cap was a genuine surprise to most observers, as was the RBA’s rate cut. Indeed, news agency Bloomberg reported on the morning of the central bank meeting that 15 out of 27 economists expected no change in rates.3
While the government says the changes in the tax concessions will not affect 96% of superannuation fund members, there clearly will be implications for many more people in the future as they progress to higher incomes.
Others can argue the rights and wrongs of these particular changes, but there is no question that the complexity and flux in superannuation rules highlight the value that an expert, independent financial advisor can bring to individuals and families.
For instance, how can you maximise your retirement income and minimise your tax? What do the changes mean in terms of when you can afford to retire? What tax-effective investment solutions are available to you outside super? If you come into an inheritance or sell a business, what are your options now?
In the case of the rate cut, people may ask about the effect of interest rate changes or inflation on their retirement saving and what strategies are available to ensure they can maintain their consumption as planned.
There are many possible challenges and questions that advisors can deal with at times like these, not only because of the complexity of tax and regulation but also due to the complexity and variability of people’s lives, circumstances, risk appetites and preferences.
And all of this takes a human advisor, as no robot or sophisticated algorithm can be programmed quickly enough to deal with policy changes that come out of left field.
Yes, change can be unsettling and makes many of us anxious. But the unpredictability of government policy, like the unpredictability of markets, will always be with us.
Like a sailing boat skipper who knows how to set the sails to deal with shifting winds and choppy seas, your financial advisor can provide the right combination of structure and flexibility in your portfolio to help you cope with policy change.
One academic study appears to confirm the view that the apparent preponderance of bad news is as much due to demand as to supply, with participants more likely to select negative content regardless of their stated preferences for upbeat news.1
“This preference for negative and/or strategic information may be subconscious,” the authors conclude. “That is, we may find ourselves selecting negative and/or strategic stories even as we state that we would like other types of information.”
So an innate and unrecognised demand among consumers for bad news tends to encourage attention-seeking commercial media to supply more of what the public appears to want, thus fuelling a self-generating cycle.
Insofar as consumers of news are investors, though, the danger can come when the emotions generated by bad news prompt them to make changes to their portfolios, unaware that the news is likely already built into market prices.
This is especially the case when the notions of “good or bad” are turned upside down on financial markets. For example, stocks and Treasuries rallied and the US dollar weakened in early October after a weaker-than-expected US jobs report. Some observers said the “bad news” on jobs was “good news” for interest rates.2
Conversely, a month later, stocks ended mixed, bonds weakened and the US dollar rallied after astronger-than-expected payrolls number. While an improving job market is good news, it was also seen by some as cementing the case for the Federal Reserve to begin raising interest rates.
In both cases, the important thing for markets was not whether the report was good or bad but how it compared to the expectations already reflected in prices. As news is always breaking somewhere, expectations are always changing.
For the individual investor seeking to make portfolio decisions based on news, this presents a real challenge. First, to profit from news you need to be ahead of the market. Second, you have to anticipate how market will react. This does not sound like a particularly reliable investment strategy.
Luckily, there is another less scattergun approach. It involves working with the market and accepting that news is quickly built into prices. Those prices, which are forever changing, reflect the collective views of all market participants and reveal information about expected returns.
So instead of trying to second-guess the market by predicting news, investors can use the information already reflected in prices to build diverse portfolios based on the dimensions that drive higher expected returns.
As citizens and media consumers we are all entitled to our individual opinions on whether news is good or bad. As investors, though, we can trust market prices to assimilate news instantaneously and work from there.
In a sense, the work and the worrying are already done for us. This leaves us to work alongside an advisor to build diverse portfolios designed around our own circumstances, risk appetites and long-term goals.
There’s no need to respond to second-hand news.
The degree of sharemarket volatility during the first three months of the year will regrettably have thrown some investors off their long-term course.
Let’s briefly recap by looking at the broad S&P/ASX 300. The index opened at 5249.10 on the first trading day of the calendar year but within three days had fallen below the much-watched 5000-point level.
The see-sawing index managed to finish the quarter above the 5000 mark at 5043.63 after a spurt on the last day of March. It was down 3.91 per cent for the quarter.
Investors who allow such abrupt short-term movements on the markets dictate their investment decisions are falling into what could be called the volatility trap.
Investors who fall into this trap often surrender their carefully-diversified long-term portfolios in an attempt to time the market. That is, trying to pick the best time to buy and sell stock.
However, most market-timers tend to sell stocks when prices have fallen – often seeking the perceived shelter of all-cash portfolios during periods of intense volatility – only to buy back into the market when prices have already recovered. In other words, such investors lock-in their paper losses.
When markets are particularly volatile, many investors also tend to focus solely on the changing prices of their shares, overlooking the critical contribution that dividends make to their total returns.
And yet another element of the volatility trap is that investors can lose their confidence about investing more of their savings into the market. This is despite the need for most of us to save for retirement and to meet our other goals.
One way that countless investors sidestep the perils of market-timing to keep on making new investments throughout changing market conditions is to practice the straightforward strategy of dollar-cost averaging.
Dollar-cost averaging simply involves investing the same amount of money into the sharemarket over regular time intervals – regardless of whether share prices are up or down.
Investors practising dollar-cost averaging buy more shares (or units in managed funds) when prices are lower and fewer when prices are higher. In short, purchasing costs are averaged over the total period that an investor keeps on investing – thus the name dollar-cost averaging.
Nevertheless, the core benefit of dollar cost averaging is not so much the price paid for shares; it is the adherence to a disciplined, non-emotive approach to investing that is not swayed by prevailing market sentiment.
The strategy can assist investors to focus on their long-term goals with an appropriately diversified portfolio while avoiding emotionally-driven decisions to buy or sell.
It should be emphasised that dollar-cost averaging does not guarantee that investments will succeed; nor does it protect investors from falling share prices. It does help foster sound investment practices.
Good investors know how to handle volatility. It is a fundamental skill. And that skill may be increasingly needed given that the 2016 Economic and Investment Outlook points to a “more challenging and volatile” investment environment over the long term.
The idea of negative interest rates can be tough to grasp. Essentially, it means that you pay a bank to look after your funds, instead of the usual practice where the bank pays you regular interest for having temporary custody of your money.
Central banks, whose job it is to implement a government’s monetary policy and issue currency, attempt to influence market interest rates by setting the rate commercial banks earn for depositing cash with them overnight.
The European Central Bank, along with peers in Japan, Switzerland, Sweden and Denmark, have all at times adopted negative interest rates recently in the face of very low inflation and the prospect of outright deflation, or falling prices.1
During a period of falling prices, real interest rates can be rising even if nominal interest rates are being cut. In such an environment, businesses and consumers may put off investing and spending on the view that it will be cheaper tomorrow.
This broadly is why central banks in those countries are cutting rates to zero or below zero. They are trying to lift inflation expectations, disincentivise saving, and, in turn, boost economic activity.
Figure 1 below shows overnight interest rates in some developed economies as of early March, 2016. These are the deposit rates that central banks set for commercial banks to leave funds with them overnight. The commercial banks in turn base their own lending rates to customers on the central bank benchmarks.

That’s all very well, you might say. But why would anyone want to pay a bank to look after their money? Why not just put the money under the mattress?
Well, first, it’s not very practical, or indeed safe, to store large amounts of cash at home. Second, some people are so focused on return of their capital over return on their capital that they are willing to pay banks to look after their money.
As well as overnight rates set by central banks and affecting retail deposits, yields on government bonds in a few countries have recently been below zero, in some cases out to maturities of 10 years or more, as in Switzerland and Japan.
Negative yields reflect both supply and demand factors, as well as the low inflation environment. On the supply side, central banks in Europe and Japan are still carrying out a policy called ‘quantitative easing’. This means that along with keeping overnight lending rates below zero, they are buying government bonds in a bid to flood the system with money and generate a self-sustaining economic recovery.
On the demand side, these negative bond yields might reflect a high degree of risk aversion among some investors. The emphasis in these cases is again more on capital preservation than on growth.
In terms of the economic environment, expectations that inflation will remain very low ameliorates one of the key risks for bond investors in that rising prices erode the purchasing power of the bond’s future cash flows.

For global fixed income investors, negative interest rates and bond yields below zero may spark concern. But does it still make sense to invest in bonds at this time and what does it mean for returns from diversified portfolios?
There are a number of responses to those questions. First, interest rates and yield curves (the trajectory drawn by bonds of the same credit quality but different maturities) are not the same in every country. For example, policy rates in the USA, the UK, Canada, Australia, New Zealand and Norway are still positive.
Rates vary because economic conditions, demand and supply factors vary across countries. The US, for instance, began raising rates from near zero late last year amid evidence of strengthening activity. Australian cash rates are around 2%, among the highest in the world.
So these different interest rate structures in different markets provide us with a diversification opportunity. Figure 2 is a snapshot of the shape, as at 31 December 2015, of five different yield curves–Australia, the US, the UK, the Euro and Japan.
Second these overseas bond returns may not be negative once they are hedged back to local currencies using local interest rates. With Australian cash rates at 2% and New Zealand’s at 2.5%, that becomes the floor for investment in global bond markets.
Hedging provides the diversification benefits of different yield curves without the currency risks. Figure 3 shows how this works.

Third, what matters to investors is not so much the absolute level of yields, but how theychange. Yields and price are inversely related, so when yields fall, prices rise. That means that even if yields are negative, they could still fall further and provide a positive capital return.
Fourth, the shape of a yield curve is more important than the absolute level of yields. For an example, an individual curve can still be upwardly sloping even if it is below zero. (In this case, shorter-term yields are below longer-term). That gives you the option of taking more term risk and getting the benefit when yields fall (prices rise).
Finally, regardless of the interest rate cycle, bonds still play a diversification role in a portfolio composed of multiple asset classes in equities, property, cash and bonds. This is because they behave differently to those other assets.
In summary, while interest rates and bond yields have turned negative in some economies as central banks attempt to stimulate activity, this doesn’t obviate the important role fixed interest can play in a diversified portfolio.
The benefits of taking a global approach to fixed interest, varying term exposure according to the range of opportunities available and hedging out currency risk remain as strong as ever.
As to the broader implications of negative interest rates for investment markets, we have not seen this phenomenon for a sufficient time to draw any firm conclusions.
In the meantime, don’t go rushing to put your money under the mattress.