Bitcoin and other cryptocurrencies are receiving intense media coverage, prompting many investors to wonder whether these new types of electronic money deserve a place in their portfolios.
Author: apcadmin
Your Super
Superannuation will become one of the most significant assets that you own – it is for this reason that you are well advised to take an active interest in the fund to which you belong.
Most employees are able to choose their preferred superannuation fund to accumulate their retirement savings – but remember, it’s only an option to choose a fund, so if you’re happy with your existing fund, you can stay put.
Who gets to choose?
The choice of super fund rules do not apply to all employees. You may not be offered choice if you are:
- Paid under a State Award or Industrial Agreement where a particular super fund is specified
- Paid under certain workplace agreements including some Australian Workplace Agreements (AWAs)
- A Federal or State Government employees who is not eligible for choice due to legislation
- Government employees who are members of the CSS or the PSS
- A member of certain defined benefit funds and have reached a certain level of benefit in that fund.
If you are not in one of the above groups it is likely that you can make your own choice of superannuation fund.
The mechanics of choice
As you might expect, there is a process to follow if you wish to choose your preferred superannuation fund – it’s not simply a matter of sending an email to your employer, saying ‘please send my super to the ABC super fund’.
Your employer’s responsibilities
Unless you fall into one of the exceptions outlined above, your employer must offer you the ability to choose your superannuation fund when you start your employment.
A standard choice form must be given to all new employees within 28 days of commencing employment.
The employer will also have chosen a default fund which is used by any employees who don’t want to make a choice or who don’t make a valid choice. The details of the default fund will be written on the choice form that your employer gives to you.
Your responsibilities
Assuming you are eligible, you can complete the standard choice from to advise your employer of your preferred fund. You will need to provide the following details:
- The name of the superannuation fund and your membership details
- The address, Australian Business Number (ABN) and unique superannuation identifier (USI) number of the fund
- A letter from your super fund confirming that it is a complying fund that can accept contributions from your employer
Importantly, if you don’t provide sufficient details to your employer, or the employer is not able to contribute to the fund, your compulsory employer contributions will be made to the default fund.
If you change your mind on which fund you prefer in the future, you can update details with your employer but they may only allow you to make one change in any 12-month period.
Key features – what to look for in a super fund
Superannuation funds offer a range of different features. It is important to compare funds and choose one that best suits your needs. Some of the key aspects to consider when making this choice include:
Insurance cover
For many people, the cheapest access to death, disablement and income protection will be through a superannuation fund. This is because the size of superannuation funds may allow them to obtain group (bulk) cover for members which may convert to lower premiums. The fund may also offer automatic acceptance limits or cover up to a certain limit without asking for medical evidence.
However, differences in premiums and cover levels between superannuation funds can vary significantly and the features may not be as extensive as offers on non-superannuation insurance policies. You need to compare carefully what you get for your money.
Investment options/performance
The range and selection of investment options can vary widely across funds. You need to think about your investment preferences and what sort of flexibility and range you wish to choose from.
Past performance is never a guarantee of future performance. However, sustained poor performance, relative to similar funds, may indicate something is wrong. Of more importance is whether the fund has a robust set of investment objectives and strategies and a well rounded range of investment options.
Fees and charges
When it comes to comparing superannuation funds, this is the aspect that seems to attract most attention – and with good reason, as seemingly small differences in ongoing fees can make a significant impact on returns over time and hence your eventual retirement savings.
For most people, the most appropriate fund will be the one that provides all the features you desire, at the lowest cost. This is not necessarily the cheapest fund.
Fund services
This includes such aspects as a useful member website and client service centre, education services, member newsletters and access to other member benefits such as discount home loans and credit cards for example. However, be careful that you’re not paying for services you don’t need.
Fund flexibility
You want to be sure that your chosen superannuation fund can grow with you as you move from your working life into retirement and beyond.
Important considerations are whether the superannuation fund can allow you to move seamlessly from accumulation phase into pension or drawdown phase, and also the types of income streams offered.
Of equal importance may be the flexibility to have any death benefits paid as a lump sum and/or pension to your dependants. Your financial planner can explain the importance of this aspect and how various options may potentially save your beneficiaries significant amounts in tax.
Your options
It is worth reiterating that while you may have the option to choose a superannuation fund, you don’t need to move anywhere if you are happy with your existing fund. But it is important to seek advice and do research to ensure you have made an informed decision.
Investments 101
Asset Classes Explained
The ups and downs in financial markets have made many investors uneasy about investing in riskier assets. In such times, it often helps to take a step back and consider each asset class to better understand how it works and what to expect.
The main types of asset classes are shares, property, bonds (or fixed interest as they are often called) and cash. Within each asset class, there are further asset types. For example, within shares, investors can choose from Australian shares, international shares or within the international shares arena, specific regions or countries like China or emerging market shares.
Investors may sometimes base their investment decision on the historical performance of asset classes although this approach is fraught with danger.
The value of $100 invested in the various asset classes since December 31, 2009 is illustrated below.
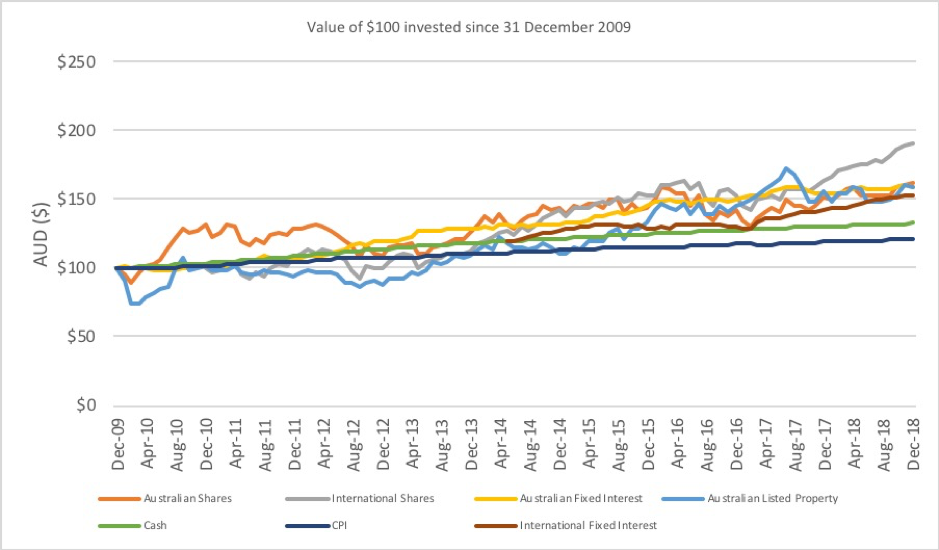
Indices used are as follows: Australian shares – S&P/ASX 300 Accumulation Index, International shares – MSCI World Ex Australia Index (net. Div. Reinvested) AUD, Australian fixed interest – S&P/ASX Australian Fixed Interest Index, International fixed interest – S&P Global Leveraged Loan Index AUD TR Hedged (note, index only in place since May 2013. Estimated $120 invested at that point), Listed property (REITs) – S&P/ASX 300 A-REIT Accumulation Index, Cash – RBA Bank Accepted Bills 90 Days. CPI ABS Consumer Price Index
It is paramount that investors understand the different asset classes to ensure they make informed investment decisions. These different asset classes are explained below.
Australian shares
Shares represent part ownership in a company. There are different types of shares such as ordinary shares, preference shares or partly-paid (contributing) shares. Owning shares in a company entitles the investor to participate in any dividends paid by the company from its profits. This represents the income return from shares.
Dividends from Australian shares often include tax benefits in the form of franked dividends. Franked dividends are dividends paid by a company out of profits on which the company has already paid tax. The investor is entitled to a franking (imputation) credit, or reduction in the amount of income tax that must be paid, up to the amount of tax already paid by the company. This means that the investor avoids paying tax twice on the profits generated by the company – once by the company and again by the investor at their own tax rate.
Share ownership also exposes the investor to movements in the share price of the company. If the share price increases above the price that it was purchased, the investor will make a capital gain. On the other hand, if the share price falls below the price at which the shares were originally purchased, the investor makes a capital loss.
The price of shares can be influenced by several factors including the performance of the local and international economies, interest rates, inflation and the magnitude of competition in the industry the companies operate in, as well as investor sentiment.
Share prices tend to fluctuate substantially over short periods of time but over longer periods such as over five and ten years, their returns tend to be more reliable. For this reason, it is often suggested that investors consider share investments only if they are willing to stay invested for at least five years.
The type of company and industry can have a major impact on the performance of the shares. Resource companies that sell commodities to countries including China and India have are affected by movements in commodity prices and have begun to benefit from a rebound in commodity prices in the last year. On the other hand, some industries like banks have benefitted by the search by investors for high yielding investments. The composition by industry of the Australian share market is illustrated in the graph below. It illustrates that almost half of the Australian share market is represented by materials and finance companies.

Source: https://www.marketindex.com.au/asx300
International shares
International shares are shares in companies that are domiciled in a country other than Australia. Investors often spread their money across a range of countries and industries. Like Australian shares, the return from international shares is made up of any dividends received as well as the capital gain or loss resulting from the change in the company’s share price. International shares are different to Australian shares in several key ways:
- The dividends paid by international shares tend to be lower than those paid by Australian companies and therefore the income return tends to be lower. Also, international shares do not have franking credits and therefore may not be as tax effective as dividends paid from Australian companies.
- International shares offer a far greater range of investment options. International shares offer access to other countries with different economic prospects such as the United States and Europe as well as China and emerging markets. International shares can also provide exposure to industries that may not be well represented in Australia. The greater spread of shares across geographies and industries can result in lower risk to your portfolio because of the diversification.
- The returns of international assets including shares are also affected by changes in the Australian dollar. Generally, if the Australian dollar strengthens, returns from international assets are reduced because the currency movement results in a loss when the international asset is converted back to Australian dollars. However, when the Australian dollar weakens, returns from international assets are increased because of currency gains.
Like Australian shares, the share price movement can be very volatile over short periods of time and it is best to invest in these only if the intention is to stay invested for at least five years.
Property
There are different types of property investments. An investor can purchase a property or number of properties directly in which case they will be benefit from the rent received by the properties as well as the change in the valuation of the property over time. The returns of these properties will be dependent on the quality of the tenant and the rent paid as well as the location and type of property such as residential, industrial or commercial.
An investor can purchase properties directly or via units in a trust that purchases the properties on behalf of investors (these are called unlisted property trusts). Accessing property via a trust often allows the investor the ability to gain exposure to more properties than if they used their investment amount to purchase property themselves. This spread of properties can reduce the overall risk of the property investment.
Investors can also gain exposure to property by buying units in a property trust that is listed on the Stock Exchange (listed REITs). Both unlisted and listed property trusts can borrow money as part of the trust structure and therefore returns to investors will be affected by the borrowings. Borrowing allows the trust to increase their purchases of properties and/or undertake development of properties. Returns to investors are paid after the borrowing costs are repaid. The level of borrowings can also add to the risk of the investment particularly if the valuation of the properties fall or the income generated by the properties is insufficient to pay the interest.
Bonds (also called fixed interest)
A bond is a tradeable debt security, usually issued by a government, semi-government or corporate body to raise money. Investors in the bond have lent money for which they receive a fixed rate of interest over a set period. The bond is repaid with interest on the predetermined maturity date. Some bonds can be traded on the share market.
The returns from bonds are based on the fixed rate of interest paid over the term. If the bond is traded the price will be affected by changes to market interest rates. If market interest rates rise, the price of the bond will fall and the investor will have a capital loss which reduces their total return. Conversely if market interest rates fall, the value of the bond will increase meaning that there will be a capital gain that adds to the overall return from the investment.
Cash
Cash is one of the safest investments. It includes cash in the bank, cash management trusts and even cash in your pocket. Cash returns are based on the official cash or interest rate which is set by the Reserve Bank of Australia as part of its monetary policy. The Reserve Bank changes the official interest rate to attempt to control inflation.
Putting it all together
The right investment depends on the individual investor and their needs and circumstances. There are several things that each investor must consider such as their investment time horizon (how long can the money be invested), the level of returns sought and the amount of risk the investor is willing to accept. Investors would be wise to combine asset classes in their portfolio to achieve diversification (that is, not putting all eggs in one basket).
It should be remembered that past returns are not a good indicator of future returns and therefore decisions on which asset class to invest in should not be based on historical performance.
At Least We Finished Strongly
For what was a torrid year on so many fronts, all APC Classic Core Portfolios recovered over the course of the last quarter in 2020. All portfolios showed a positive return against their ‘benchmark’ (or the market) over the minimum recommended investment time frame with the lone exception being the APC Classic 100 portfolio.
Global investment markets found optimism finishing 2020 very strongly (up nearly 6% for the quarter) on the back of news regarding vaccine breakthroughs and (eventual) certainty around US Presidential Election results. The Australian share market was actually one of the strongest performing lifting by ~14% in the quarter thanks to strong results in ‘Small Cap’ and ‘Value’ companies – both of which are targeted premiums in APC’s Classic Core Portfolios.
The Australian economy expanded with Gross Domestic Product (GDP) rising 3.3% and the Aussie dollar rallied against the US finishing just south of US$0.77. However, this was more about a weakening ‘greenback’ which fell ~7% across a broad range of currencies.
Property investments also showed strong signs of recovery (up over 13% for the quarter) after what has been a very challenging period (still down ~4% for the 2020 calendar year) with some pivoting their focus towards regional areas as opposed to CBDs.
With global interest rates remaining low (and probably staying such for some time to come yet) the cash and fixed interest investment environment continues to be challenging however there was a noticeable ‘term premium’ evident and ‘credit spreads’ returned to pre-Covid type levels.
2020 has once again reminded us to ‘stay the course’ and not ‘panic selling’ during times of significant market volatility as the ‘upside’ that so often follows the ‘downs’ assists in a swifter recovery from shocks.
Building Resilience
By Jim Parker Vice President, Jan 12, 2021
In media forecasts for 2020, a global pandemic and the worst recession since the 1930s weren’t high on everyone’s list of threats. But even had these events been foreseen, who would have tipped global equities to reach record highs a year later?
Yes, it’s a cliché to compare the ups and downs of the share market to a rollercoaster, but for once the metaphor has rung true. After many markets hit record highs in February, they suffered a gut-wrenching slide of more than 30% in five weeks.
The recovery from April was just as dramatic. By late November, the MSCI World index had surpassed February’s pre-pandemic records. Investors began to anticipate an economic recovery and were cheered by news that three different vaccines, promoted by their makers as highly effective, would soon be available. By 31 December, the Australian equity market, as measured by the S&P/ASX 300 index (total return) was up 1.7% for the calendar year, while the MSCI World-ex Australia index was 5.7% higher.
The sheer volatility in prices mirrored our emotional swings. After all, this was a health crisis first and foremost. As of 31 December, 1.8 million people had died from COVID-19, while more than 83 million cases had been reported worldwide.1
On top of the medical anxieties were threats to livelihoods. With entire industries and economies severely disrupted by the pandemic, governments and central banks announced unprecedented levels of policy stimulus. Even so, the International Monetary Fund in October projected a historic global GDP contraction of 4.4% in 2020, the worst annual plunge in activity since the Great Depression.2
COVID-19 also changed the way we lived and worked. Our homes became offices and classrooms. Time formerly spent commuting was now absorbed with work and study. For some, the working day started much earlier. For others, it ended later. Old schedules were discarded.
Perhaps what was most striking is how well we adapted in the face of significant economic and social disruption. Previously un-thought of travel restrictions, social distancing, mask wearing, and contact tracing apps are now facts of life.
The urge to protect ourselves and our loved ones from an external health hazard was such we were prepared to give up some freedoms. Granted, not everyone accepted these without complaint, but compliance was the rule rather than the exception.
The rules around good investment practice were reinforced as well. When volatility turned so extreme in late March that even the US Treasury market became unsettled3, there was a temptation among many to retreat to cash. But those who listened to their advisors would no doubt be thanking them now.
The first rule we were reminded of is that markets work. That doesn’t mean they’re perfect or that they go only in one direction. When there is a lot of uncertainty, there will be a lot of volatility. But trying to second-guess prices is futile. Even if you could forecast news events like a pandemic, you still have to work out how markets will react.
Given the impossibility of outguessing markets, the second rule is to rebalance to maintain one’s chosen asset allocation. Amid the sharp decline in shares in the first quarter this year, bonds – like shock absorbers in a motor vehicle – continued to play a key role in preserving capital, lessening portfolio volatility and making for a less bumpy ride. Those who used this opportunity to rebalance their portfolios back toward their desired allocation reaped the benefits.
Third, diversification was again shown to be critical in improving the reliability of outcomes. Obviously some stocks and sectors were more exposed to a pandemic that brought travel to a virtual halt and reduced human contact. Airlines, cruise ships and tourism-related stocks were all hard hit, as were traditional bricks-and-mortar retailers.
On the other side, home entertainment stocks like Netflix, digital media companies like Facebook and Google, online retailers, and some healthcare stocks did remarkably well. In Australia, gold and iron ore miners bucked the overall downtrend. Being broadly diversified matters because it reduces risks associated with individual companies or sectors and is a critical tool in reliably capturing the premiums you are targeting.
Fourth, rarely has the value of discipline been demonstrated so vividly. While there was no denying the anxiety we felt, trying to get off the rollercoaster in the middle of the ride was only likely to make matters worse. Well-advised investors instead learnt to hold on tight and stay focused on their destinations.
Of course, there inevitably will be further challenges ahead. Markets may become volatile again, as is their nature. The pandemic is still with us. While there has been encouraging news on vaccines, hurdles have still to be overcome in manufacture, storage, distribution and compliance. While many economies, including Australia and New Zealand, have bounced back from the initial shock, scars remain.
But the philosophy underlying effective personal responses to external health and wealth threats is similar. In both cases, we do best by focusing on what we can control. In health, this includes frequent hand-washing, mask-wearing and social distancing. In wealth, it is asset allocation and rebalancing, diversification, discipline, and accepting that markets will do what they do, absorbing news instantaneously and looking forward.
None of this can ever make the uncertainty go away. But it can make us feel less anxious and more resilient in the face of whatever comes our way in the future.
That’s the best lesson 2020 gave us.
FOOTNOTES
- 1World Health Organisation COVID-19 Dashboard.
- 2World Economic Outlook, IMF, Oct 2020.
- 3Monetary Policy Report, US Federal Reserve, June 2020.
DISCLOSURES
AUSTRALIA and NEW ZEALAND: This material is issued by DFA Australia Limited (AFS License No. 238093, ABN 46 065 937 671). This material is provided for information only. No account has been taken of the objectives, financial situation or needs of any particular person. Accordingly, to the extent this material constitutes general financial product advice, investors should, before acting on the advice, consider the appropriateness of the advice, having regard to the investor’s objectives, financial situation and needs. Any opinions expressed in this material reflect our judgement at the date of publication and are subject to change.
No Free Lunch, No Free Investing
An article by Rick Kahler, MS, CFP®, CFT-I™, ChFC, CCIM
“There’s no such thing as a free lunch”. The adage suggesting you can’t get something for nothing seems to have bitten millions of unwitting investors who used a popular trading platform in the USA, Robinhood.
This summer, my 19-year-old son proudly informed me he was a Tesla owner – the company, not the car. Knowing Tesla was selling around $200 a share, I asked how many shares he purchased. He said “$15 worth. I don’t know how many shares that is. I found an app called Robinhood that allowed me to buy any amount I wanted.”
In the ensuing weeks, he checked the price of his purchase daily, watching his $15 run up to $22 and then slowly fall back to $14. Prior to this experience, his investments were diversified index funds that tended to be far less volatile. The daily volatility turned out to be too much for his young stomach to handle. He sold out his position in Tesla at $14.53 to realise a $0.43 loss and concluded, “I am not doing that again.”
Robinhood revolutionised the way small and younger investors can buy and sell shares, options, and cryptocurrency by eliminating minimum purchases and trading fees. The app, with its name implying it takes from the rich and gives to the poor, makes it easy and fun for anyone to invest.
How does a free app make money? Saloons of the 1890s gave away a lunch with every drink purchased. The free food was heavily salted, which resulted in the patrons buying a lot more high-priced beer than they planned.
Similarly, Robinhood used the concept of a heavily salted “free lunch” by using gaming-type experiences that encouraged their customers to trade more frequently and invest in higher-risk investments like bitcoin and options, all of which made the company more money.
Robinhood made much of their money by auctioning off their customer’s trading orders to the firm that would pay them the most money, resulting in the worst deal on pricing for their customers. The Securities and Exchange Commission (SEC) said Robinhood’s customers paid over $34 million (USD) more than they would have paid with other brokerage firms that charged fees.
What got Robinhood into trouble with the SEC was misleading consumers by not disclosing that customers paid the highest possible prices for the shares they purchased and received the lowest price for those they sold. The company agreed to pay a $65 million fine to settle the charges in December 2020.
Before you sign on for financial products or services that are “free”, first clarify how the company or person is making their money. If the answer is not clear and understandable, move on. The chances are that you’ll end up with the lowest overall cost by paying a fully transparent and disclosed fee.
Because the old adage is right! There is no such thing as a free lunch.
Client Briefing Video
Given the obvious difficulties associated with large gatherings at present, the APC team has put together a video client briefing which we hope you will find informative and of value. There are five separate videos located in the Resources section of our website which can be found at the following link;
https://australianprivatecapital.com.au/resources/
Once you land on the page please scroll down to the section headed Client Briefings where the following videos will be available for you to review. They are designed for you to review them in order however you are of course free to view them in whatever order you wish.
Video 1: Introduction and economic update – Robert Sarafov: Director and Senior Adviser
Rob will take you through the agenda for the briefing along with an economic update. Watching this video will hopefully assist you to gain a better understanding of current key economic themes and explain what APC is keenly observing in the current environment and likely effects on markets.
Time: 12:20
Video 2: Portfolio and market performance – Hayden Windsor: Director and Senior Adviser
Hayden will briefly cover how difficult it is to predict future market movement and how COVID and particular investment themes have impacted the Classic portfolios over 2020. This video will illustrate that even during a tough year the Classic portfolio suite has broadly held it’s own.
Time: 6:11
Video 3: APC’s CORE + Satellite investment approach – Carol Tawfik: Senior Adviser
Over the past few eNews communiques, APC has introduced you to our evolved investment methodology called our CORE + Satellite Approach. Carol delves a little deeper into this concept for you and explains how it works. Watch this video to better understand its benefits to you as an investor.
Time: 10:22
Video 4: Get to know our newest shareholder – Robert Sarafov / Hayden Windsor/ Carol Tawfik
Recently Carol joined APC’s share registry as our third shareholder! Rob, Hayden and Carol casually chat about the journey APC has been on since March 1988 when our founding partner, Michael Tratt, started the company. Watch this video to get to know Carol a little better as well as to understand the direction and focus for APC in the years to come.
Time: 8:51
Video 5: NGV and closing remarks – Robert Sarafov and Carol Tawfik
As you will know, APC has had for many years a very close partnership with the National Gallery of Victoria (NGV). In this video Rob briefly introduces the NGV’s 3D tours and invites you to take a ‘deep dive’ into their dedicated website. Carol then offers some closing remarks to bring the briefing to a close.
Time: 2:18
On behalf of the entire APC Team, we hope you find the briefing of interest and value!
APC News November 2020
APC Foundation Client Service Benefits
As a Private Client of Australian Private Capital you have the opportunity to extend certain valuable services to your children via the Foundation Client Service which is our service specifically tailored for young adults. The following are available right now;
Debt Review: If you have any children who have existing loans then allow APC the opportunity to facilitate a review and market comparison by a debt specialist to make sure your child’s loan is as competitive as possible. There is no fee for this review and if a new loan is put in place you can help your child lower their ongoing repayment and with APC’s Commission Rebate Policy this can mean hundreds if not thousands of dollars in commission returned to them!
Insurance Review: If you have a working child, chances are they will have personal insurances such as Life, Total & Permanent Disability, Income Protection or Trauma. These can be expensive. What many people do not realise is that the commission paid to insurance advisers by the insurance companies to sell their products is between 25% and 30% of the annual premium! You can help your child lower the cost of insurance by allowing APC to review their existing insurances. Not only can we ensure they have the right levels of cover in place but with APC’s Commission Rebate Policy we will return to them annually the 25% – 30% of premium commission rebate!
What should you do?
Talk to your kids and let them know of these services that are available to them by virtue of your APC Private Client Service. If you have working children with either a loan or personal insurance you can help them lower the cost of both or at least give them peace-of-mind that their current circumstances are as optimal as possible!
What financial services could we offer that we don’t?
In our most recent client survey, which we provided feedback to you on in our last E-News, we scored highly across the board although our lowest score (still a high 4.59 out of 5.00) was Range of Financial Services. We believe APC provides our clients a comprehensive range of services however we are always very interested to receive your feedback of services that you would like us to provide you, which we currently do not.
What should you do?
If there is a financial service you would like us to consider including in our Private Client Service please email to enquiries@apcas.com.au with the subject RANGE OF FINANCIAL SERVICES FEEDBACK your suggestion and we will investigate and personally respond back to you with our findings and the outcome.
APC’s new Resources section
APC has now included in our website a new Resources library, which contains short videos explaining various wealth management strategies which we implement with our clients. This Resources section has been deliberately located in the public area of our website so you may share them with family or friends.
You can locate this new Resources section here.
APC’s office operations – including Christmas and New Years
Currently APC is not able to operate in our offices due to Victorian Government COVID restrictions however it is our intention to return to our office as soon as we are able to do so.
Christmas and New Years
Our offices will be closing for a 2 week Christmas break at 3pm on Thursday December 24th and re-opening at 9am on Monday January 11th 2021.
Large and In Charge
A top-heavy stock market with the largest 10 stocks accounting for over 20% of market capitalization and a marquee technology firm perched at No. 1? This sounds like a description of the current US stock market, dominated by Apple and the other FAANG stocks,1 but it is actually a reference to 1967, when IBM represented a larger portion of the market than Apple at the end of 2019 (5.8% vs. 4.1%).
As we see in Exhibit 1, it is not particularly unusual for the market to be concentrated in a handful of stocks. The combined market capitalization weight of the 10 largest stocks, just over 20% at the end of last year, has been higher in the past.
EXHIBIT 1 – Same Old Story
Weight of largest stocks by market capitalization in US stock market, 1927–2019

A
A breakdown of the largest US stocks by decade in Exhibit 2 shows some companies have stayed on top for a long time. AT&T was among the largest two for six straight decades beginning in 1930. General Motors and General Electric ranked in the top 10 at the start of multiple decades. IBM and Exxon were also mainstays in the second half of the 20th century. Hence, concentration of the stock market in a few large companies such as the FAANG stocks in recent years is not a new normal; it is old normal.
EXHIBIT 2 – Big Board
Largest 10 US stocks at the start of each decade

A
Moreover, while the definition of “high-tech” is constantly evolving, firms dominating the market have often been on the cutting edge of technology. AT&T offered the first mobile telephone service in 1946. General Motors pioneered such innovations as the electric car starter, airbags, and the automatic transmission. General Electric built upon the original Edison light bulb invention, contributing to further breakthroughs in lighting technology, such as the fluorescent bulb, halogen bulb, and the LED. So technological innovation dominating the stock market is not a new normal; it is an old normal too.
Another trend attributed to a new normal is the extraordinary performance of FAANG stocks over the past decade, leading some to wonder if we should expect these stocks to continue such strong performance going forward. Investors should remember that any expectations about the future operational performance of a firm are already reflected in its current price. While positive developments for the company that exceed current expectations may lead to further appreciation of its stock price, those unexpected changes are not predictable.
To this point, charting the performance of stocks following the year they joined the list of the 10 largest firms shows decidedly less stratospheric results. On average, these stocks outperformed the market by an annualized 0.7% in the subsequent three-year period. Over five- and 10-year periods, these stocks underperformed the market on average.
EXHIBIT 3 – Power Down

Annualized return in excess of market for stocks after joining list of 10 largest US stocks, 1927–2019
A
Past performance is not a guarantee of future results.
The only constant is change, and the more things change the more they stay the same. This seems an apt description of the dominant stocks atop the market. While the types of businesses most prominent in the market vary through time, the fact that a small subset of companies’ stocks account for an outsized portion of the stock market is not new. And it remains impossible to systematically predict which large companies will outperform the stock market and which will underperform it. This underscores the importance of having a broadly diversified equity portfolio that provides exposure to a vast array of companies and sectors.
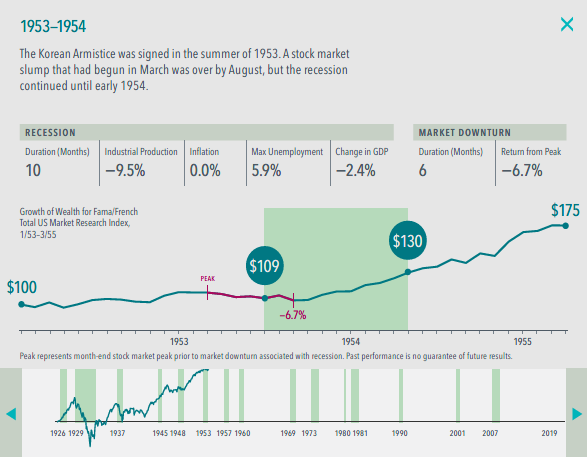
Market Returns Through a Century of Recessions
What does a century of economic cycles teach investors about investing? Our interactive exhibit examines how stocks have behaved during US economic downturns. Markets around the world have often rewarded investors even when economic activity has slowed. This is an important lesson on the forward-looking nature of markets, highlighting how current market prices reflect market participants’ collective expectations for the future.


Past performance is no guarantee of future results. Investing risks include loss of principal and fluctuating value. There is no guarantee an investment strategy will be successful.
Indices are not available for direct investment. Their performance does not reflect the expenses associated with the management of an actual portfolio.
Indices are not available for direct investment. Their performance does not reflect the expenses associated with the management of an actual portfolio.
NOTES AND DATA SOURCES
- In US dollars. Stock returns represented by Fama/French Total US Market Research Index, provided by Ken French and available at http://mba.tuck.dartmouth.edu/pages/faculty/ken.french/data_library.html. This value-weighed US market index is constructed every month, using all issues listed on the NYSE, AMEX, or Nasdaq with available outstanding shares and valid prices for that month and the month before. Exclusions: American depositary receipts. Sources: CRSP for value-weighted US market return. Rebalancing: Monthly. Dividends: Reinvested in the paying company until the portfolio is rebalanced.
- Growth of wealth shows the growth of a hypothetical investment of $100 in the securities in the Fama/French US Total Market Research Index from July 1926 through December 2019.
- Gross Domestic Product (GDP) based on quarterly data from the US Bureau of Economic Analysis; quarterly data not available prior to 1947. Percentage change in GDP based on business cycle peak to trough quarter as reported by National Bureau of Economic Research (NBER).
- Industrial Production, Inflation, and Unemployment based on monthly data from Federal Reserve Bank of St. Louis (FRED); Unemployment data not reported prior to 1929.
- All calculations are cumulative.
DISCLOSURES
The information in this document is provided in good faith without any warranty and is intended for the recipient’s background information only. It does not constitute investment advice, recommendation, or an offer of any services or products for sale and is not intended to provide a sufficient basis on which to make an investment decision. It is the responsibility of any persons wishing to make a purchase to inform themselves of and observe all applicable laws and regulations. Unauthorized copying, reproducing, duplicating, or transmitting of this document are strictly prohibited. Dimensional accepts no responsibility for loss arising from the use of the information contained herein.
Eugene Fama and Ken French are members of the Board of Directors of the general partner of, and provide consulting services to, Dimensional Fund Advisors LP.
Data presented in the Growth of Wealth chart is hypothetical and assumes reinvestment of income and no transaction costs or taxes. The chart is for illustrative purposes only and is not indicative of any investment.
“Dimensional” refers to the Dimensional separate but affiliated entities generally, rather than to one particular entity. These entities are Dimensional Fund Advisors LP, Dimensional Fund Advisors Ltd., Dimensional Ireland Limited, DFA Australia Limited, Dimensional Fund Advisors Canada ULC, Dimensional Fund Advisors Pte. Ltd, Dimensional Japan Ltd., and Dimensional Hong Kong Limited. Dimensional Hong Kong Limited is licensed by the Securities and Futures Commission to conduct Type 1 (dealing in securities) regulated activities only and does not provide asset management services.
AUSTRALIA and NEW ZEALAND: This material is issued by DFA Australia Limited (AFS License No. 238093, ABN 46 065 937 671). This material is provided for information only. No account has been taken of the objectives, financial situation or needs of any particular person. Accordingly, to the extent this material constitutes general financial product advice, investors should, before acting on the advice, consider the appropriateness of the advice, having regard to the investor’s objectives, financial situation and needs. Any opinions expressed in this material reflect our judgement at the date of publication and are subject to change.
RISKS
Investments involve risks. The investment return and principal value of an investment may fluctuate so that an investor’s shares, when redeemed, may be worth more or less than their original value. Past performance is not a guarantee of future results. There is no guarantee strategies will be successful.